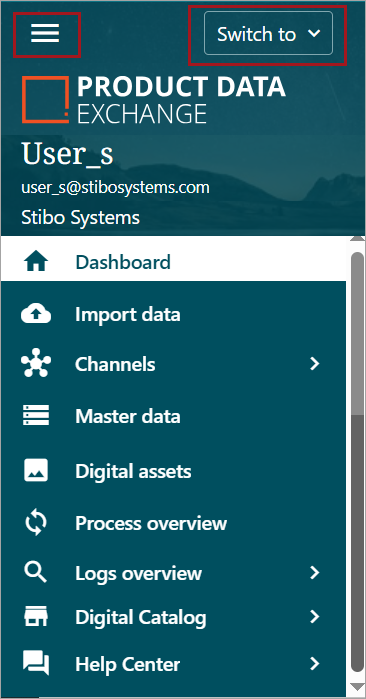
The sidebar is a static side panel that is visible in every section of the PDX tool. At the top of the panel is an option to minimize the panel, providing a larger viewing area for the PDX tool, and a dropdown that provides options to navigate to other areas within the PDX suite of applications. The sidebar also contains clickable links, some with dropdown menus.
Top Panel Options
The top of the sidebar contains a hamburger menu item ( ), which can be used to minimize the panel. The top also contains a 'Switch to' dropdown menu to open other PDX applications.
-
Hamburger Menu: When the hamburger menu icon is clicked, the side panel will significantly reduce in size, providing a larger viewing area of the open section. Clicking on the icon again will return the sidebar to its original size.
-
Switch to Dropdown Menu: Below is a screenshot of an open 'Switch to' dropdown menu. "Switch to' gives access to different options. Users will have different options depending on their user setup and permissions. Availability of navigation options will vary from customer to customer.
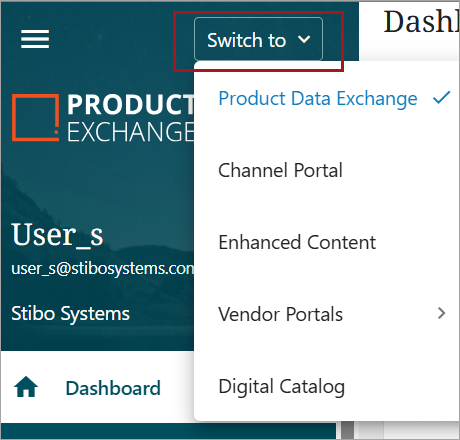
Examples of access level are below:
-
If you are a supplier with access to a channel with vendor portal activated, a vendor portal entry is provided.
-
If you are a retailer and own channels on the PDX Platform, access to the Channel Portal is provided.
-
If you are a brand or a supplier and have been given access to products enhanced content for Amazon channel or an Onboarding channel, access to Enhanced content is provided.
-
f you are a brand, you can set up Digital Catalogs using a configured channel. Doing so provides access to the Digital Catalog
Sidebar Clickable Links
The sidebar contains clickable links, some with dropdown menus, for the following topics:
Dashboard
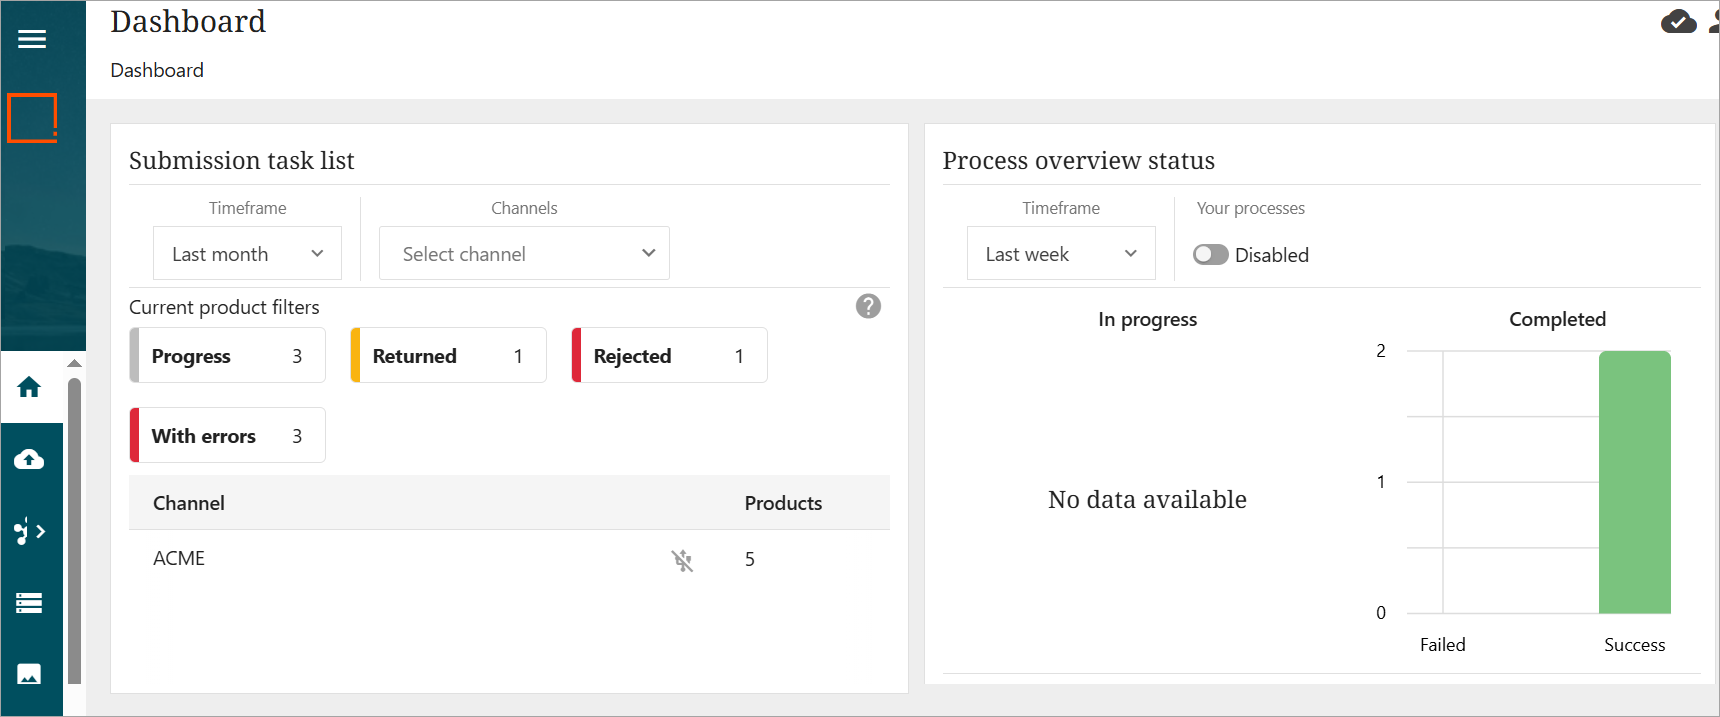
The Dashboard is the landing page for PDX. The Dashboard streamlines issue resolution within PDX by providing users with comprehensive insights into active processes and pinpointing specific areas that require focus and intervention. Detailed information is available in the Dashboard topic.
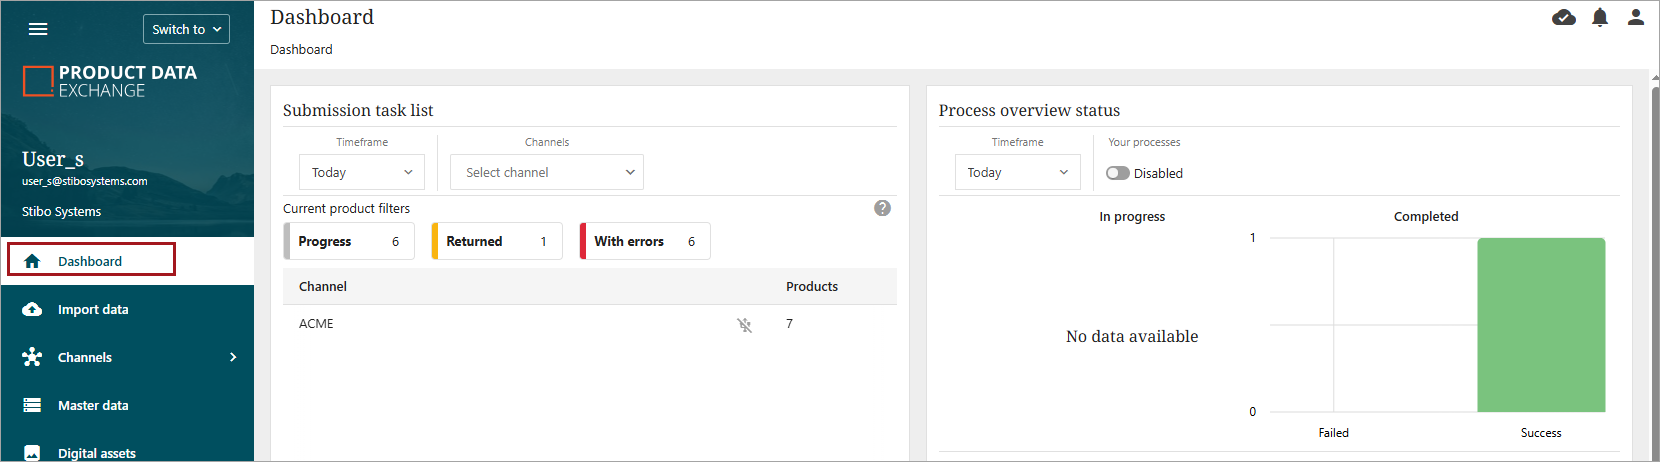
Note: In clients with low activity, this area may have very few entries or even be empty.
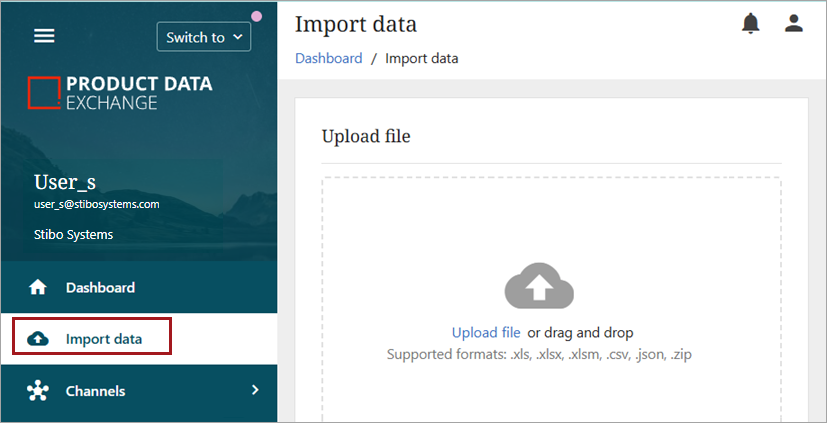
Import Data
The Import data screen allows users to upload products and their attributes via spreadsheet. Supported formats are the following: .xls, .xlsx, .xlsm, .csv, .json, .zip. Complete information on the Import data process is available in the Import Data Screen topic.
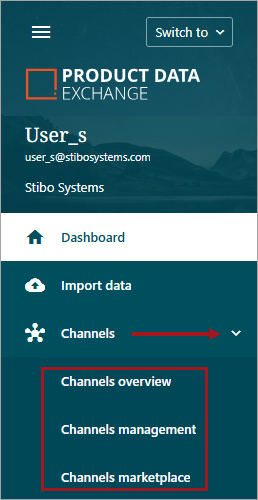
Channels
Channels will open the subtopics Channels overview, Channels management, and Channels marketplace. Detailed information is available in the Channels topic.
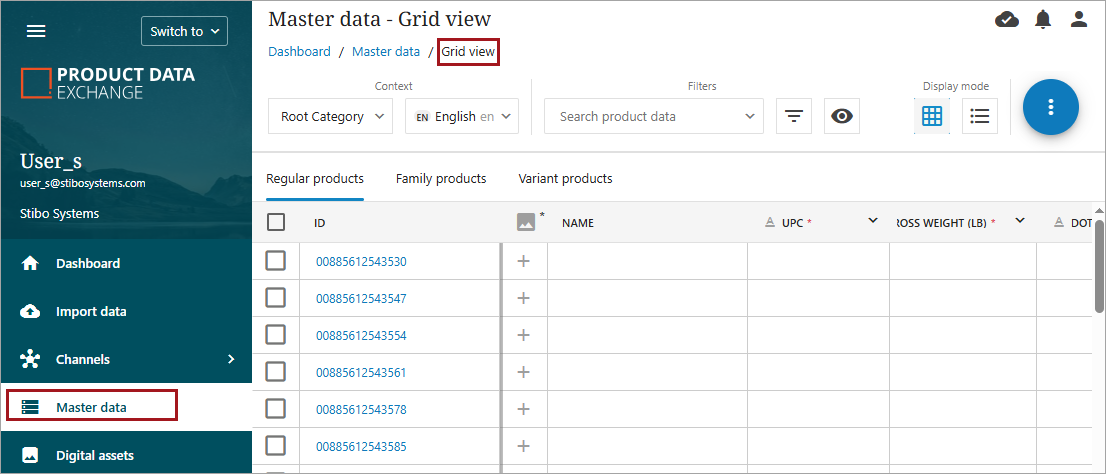
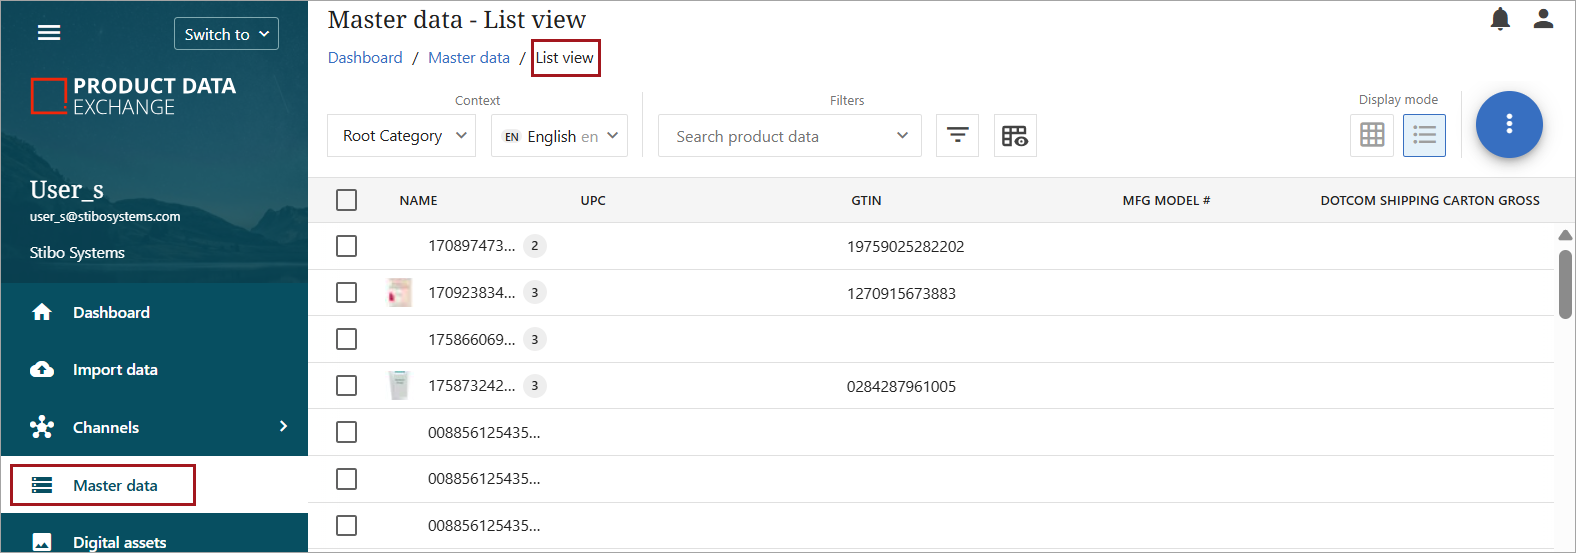
Master data
The Master data screen takes the user to the complete listing of master data / products, regardless of the product's availability and/or status in one or more channels. Users can view master data in either Grid view or List view. Detailed information is available in the Master Data topic.
-
Grid view
-
List view
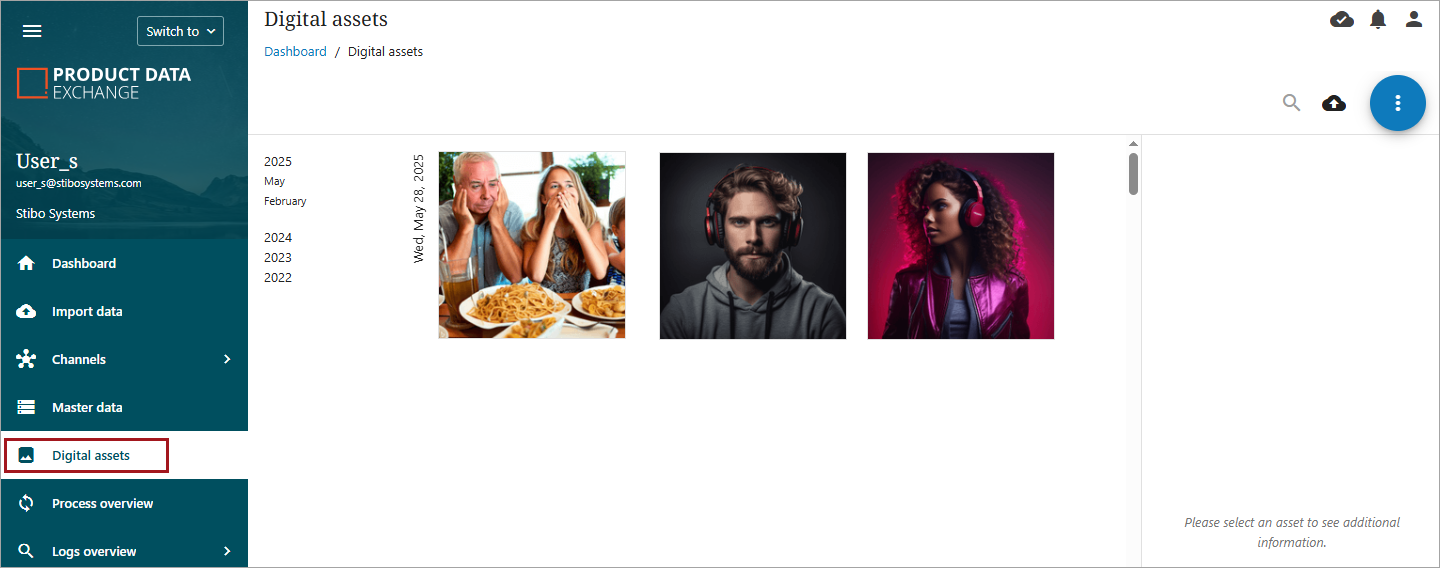
Digital assets
The Digital assets screen takes the user to all digital assets that have been uploaded and are available for use. Digital assets are typically images (most formats allowed) or PDFs. Detailed information is available in the Digital Assets topic.
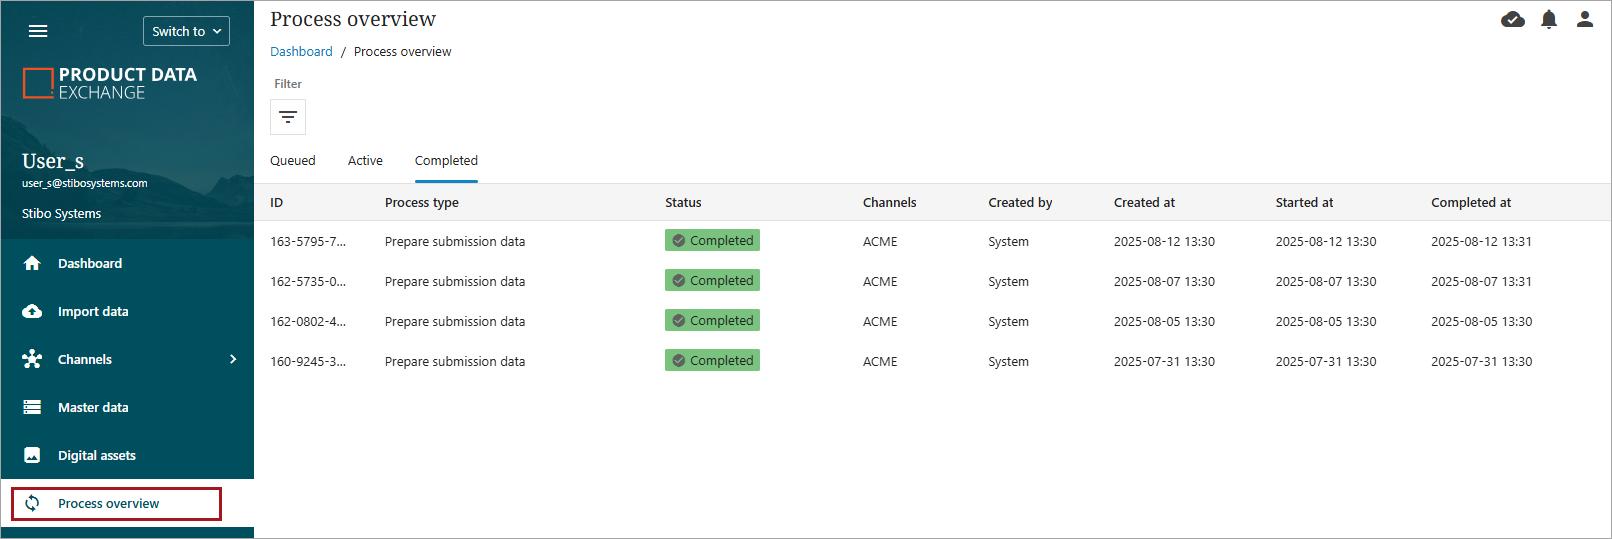
Process overview
The Process overview takes the user to the Process overview screen. The Process overview displays important processes (workflows) that were initiated in PDX.
The process overview contains three tabs, each displaying which state the process is in. A process will first be in the 'Queue,' and when the process starts it will be moved to the 'Active' tab. When the process has been completed it will be displayed on the 'Completed tab.'
Detailed information is available in the Process Overview topic.
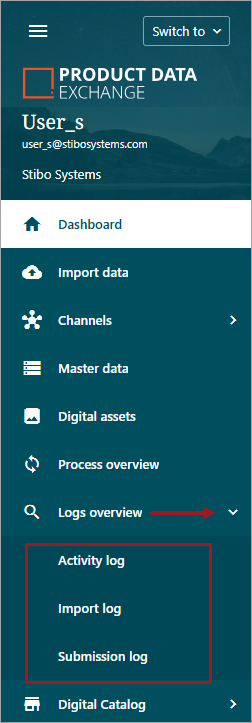
Logs overview
The Logs overview section of the sidebar expands to open the Activity log, Import log, or Submission log. Each log contains detailed and specific information regarding actions performed in PDX. For more information on the logs, refer to the Logs Overview topic. This topic contains a clickable link for each of the individual logs.
Digital Catalog
The Digital Catalog menu item expands to open Data Monitoring and Request Log clickable menu items. For expanded information on Data Monitoring and Request Log menu items, refer to the Digital Catalog Dropdown topic. For more information about creating and managing a Digital Catalog, refer to the Digital Catalog topic.
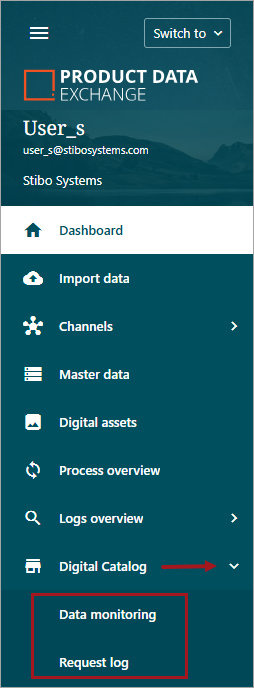
Note: The Digital Catalog sidebar menu item will not be available to all users. The Digital Catalog is only relevant for brands that use configured channels and Digital Catalog.
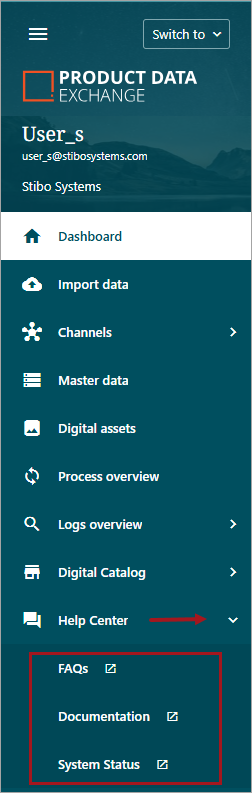
Help Center
The Help Center menu item expands to open the FAQs, Documentation, and System Status clickable menu items. When clicked, each item will open a new browser tab with the topic's URL.
For more information about the Help Center, refer to the Help Center Screen topic.