The flyout panel is available to be added to the Node Details screen and Node List components in the Web UI, giving you the ability to view analytics information in a conceptualized manner for both single nodes and multiple nodes. The flyout panel displays Power BI reports and provides the ability to toggle between multiple reports. By presenting analytics information in context with the content being analyzed, the Power BI flyout panel provides users a seamless, contextual interface to help in their decision-making processes.
Displaying and Using the Flyout Panel
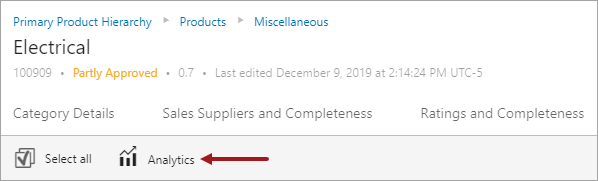
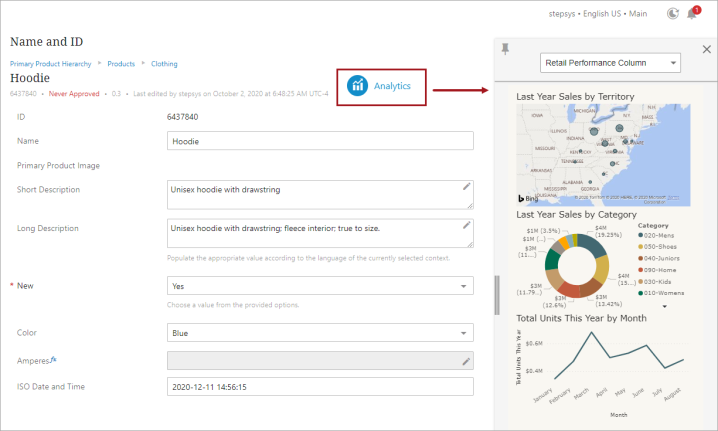
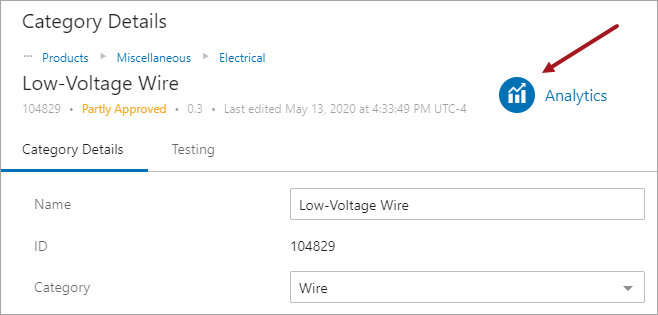
Node Details: When the flyout panel is configured on a Node Detail screen, navigate to an object and click the Analytics button in the 'Below Title' component (top area) of the screen. The panel will display on the right.
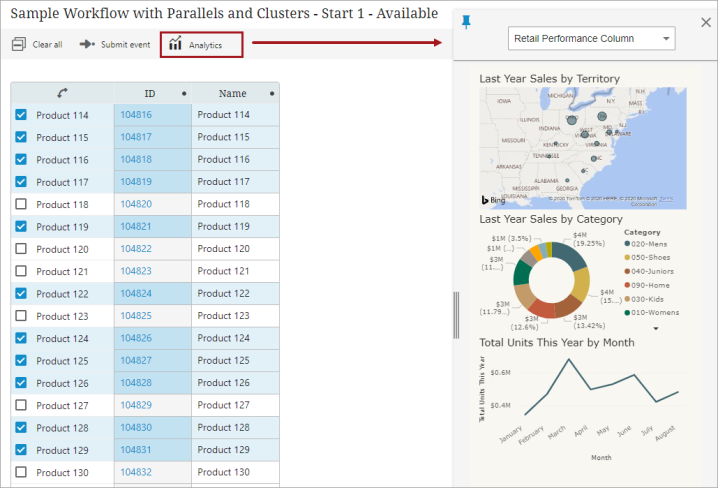
Node List: If you access the flyout panel from a Node List, where the Analytics action has been configured to display in the toolbar, you simply make a single or multiple object selection and then click the Analytics button.
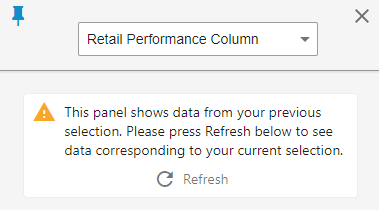
If you have the flyout panel pinned and select another object from the Node List, the panel will display a message giving you the option to refresh.
Features of the flyout panel include:
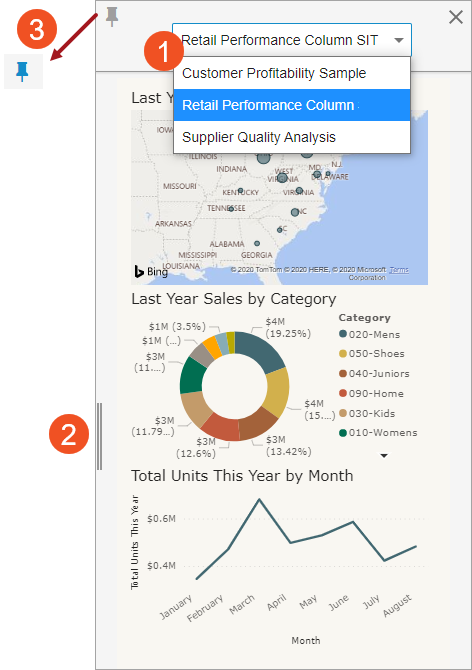
- A dropdown list displays at the top of the panel, which allows you to toggle between different reports.
- The panel is resizeable; you can drag the handle on the left side of the panel and drag it to the left across the screen to view larger widgets. The maximum height is 400 px; widgets start with a height of 255 px. Most reports grow larger / automatically resize as you expand the panel; however, all do not, such as prices and indicator widgets.
- If you click outside the flyout panel and the panel is not pinned, it will retract. If you want the panel to remain open as you update the object, click the pin icon and the panel will remain open. The pin is gray when unpinned, and it turns blue when pinned.
The Web UI will remember your preferences if you navigate away from the page then come back and when you exit your Web UI instance and log back in. The report you were last on will display each visit until you change it, and the system will remember if you pin the flyout panel and/or if you resized it.
If you click another 'global' flyout panel, such as alerts or BGP, the analytics panel will be replaced by the other flyout until the Analytics button is clicked again, even if the Power BI flyout panel is pinned.
Configuring the Flyout Panel
Prerequisites
It is expected that anyone configuring the component is familiar with the Web UI Design Mode as basic concepts for working with the designer are not covered in this section. In addition, the user must have appropriate privileges to access the designer. Additional information can be found in the Designer Access topic in the Web User Interfaces documentation.
Adding to a Node Details screen
The panel supports product, classification, and entity objects and is added to Node Details screens in Web UI as a 'Below Title' summary card child component (either as a Product Summary Card, Classification Summary Card, or Entity Summary Card).
To configure this panel, in the Node Details component, add the applicable Summary Card component as a child component to the Below Title component. For general configuration details about these Summary Cards, refer to the Below Title Component topic in the Web User Interfaces documentation.
For the steps below, the Product Summary Card component will be used to outline the Power BI flyout panel configuration. The steps will be similar for the Entity Summary Card and Classification Summary Card.
- Within Node Details Properties, add the 'Product Summary Card' as a child component to the Below Title component, then click 'go to component.'
- On Product Summary Card Properties, select Analytics from the Secondary Summary Card Section dropdown list. (This option will only display if the Analytics commercial license is activated for your system,)
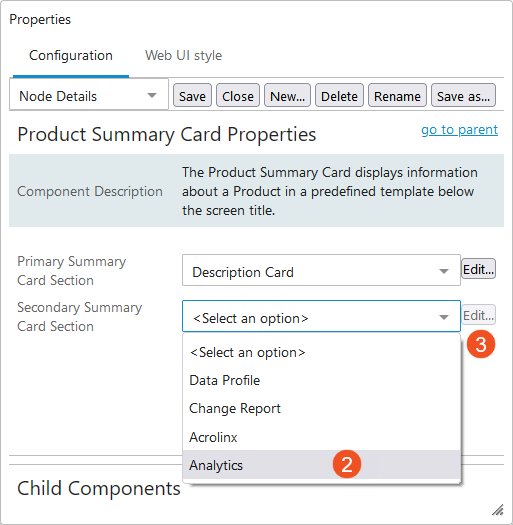
- The Analytics Properties will open automatically with new setups. If making changes to an existing setup, click Edit... to open the Analytics Properties.
- In Analytics Properties, add a Power BI Report ID.
- For Report Page, enter the name of the Power BI report page that you want to display when the report loads in the flyout panel.
- Select / configure the JSON Parameters and Filter String parameters. For example:
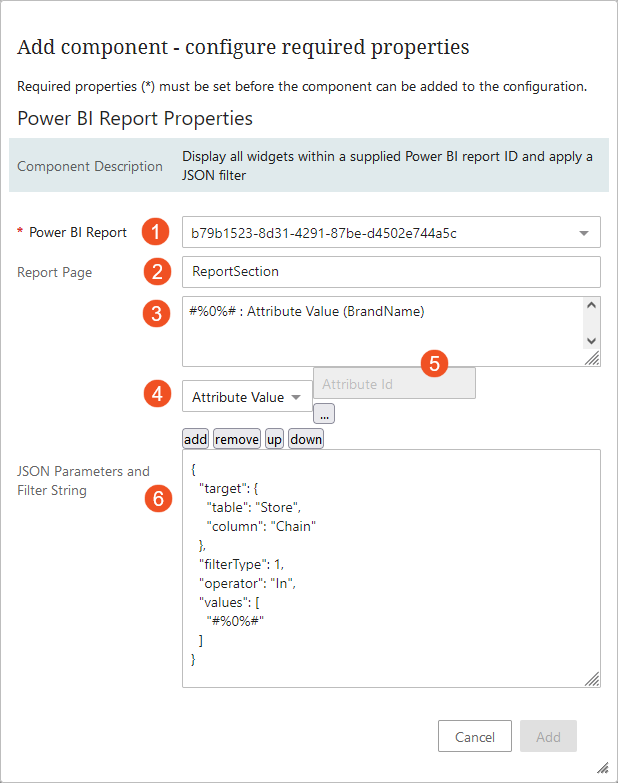
For more information on using JSON strings to filter Power BI reports, refer to the Example Power BI Report Filters topic. You can also refer to the 'Filter Configuration Options: JSON Parameters and Filter String' section in either the Power BI Web UI Screen topic or the Power BI Web UI Widget topic.
- Click Save to complete the configuration.
- Repeat steps 4 through 7 to add additional reports.
- Click Save in Analytics Properties to save the settings.
- Click Save and then Close to exit Web UI Design Mode.
A clickable Analytics button now displays below the title.
Adding to a Node List component
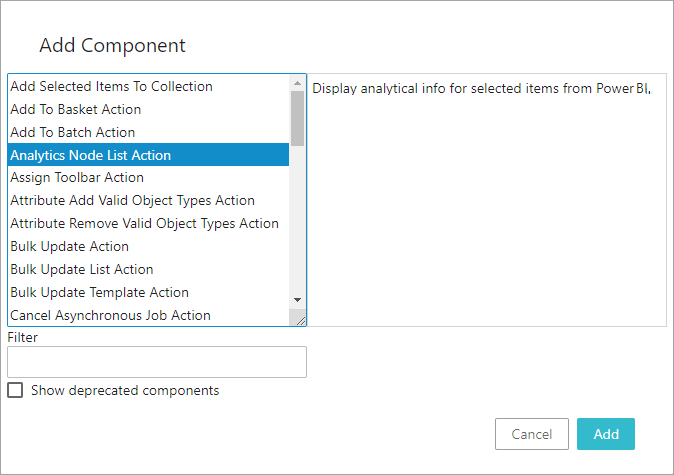
The Analytics button can also be added to the Node List component as a child Analytics Node List Action. Adding this action will display the action button in the toolbar. Users can then click the button to view a Power BI flyout panel for the selected node(s).
- Within Node List Properties, go to Child Components. Click Add under the Actions field.
- In Analytics Node List Action Properties, add a Report ID.
- Enter a Report Page.
- Select / configure the JSON Parameters and Filter String parameters. Refer to the section above for an example, and refer to the Example Power BI Report Filters topic.
- Click Save to complete the configuration.
- Repeat steps 4 through 7 to add additional reports.
- Click Save in Analytics Node List Action Properties to save the settings.
- Click Save and then Close to exit Web UI Design Mode.
A clickable Analytics action button now displays in the toolbar.