Power BI Web UI Screen
The visual integration with Power BI uses two components to display analytics data in the Web UI: the Power BI Widget and the Power BI Screen. This topic details the configuration of the Power BI Screen. The Power BI Screen is used to configure full-screen Power BI dashboards and Power BI reports.
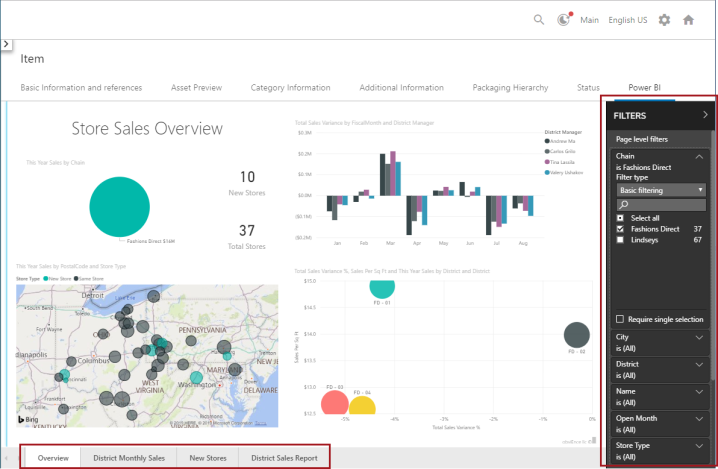
The following screenshot shows a sample Power BI report on a Power BI screen in the Web UI. An optional filter panel is shown on the right side of the screen, and an optional page navigation panel appears on the bottom.
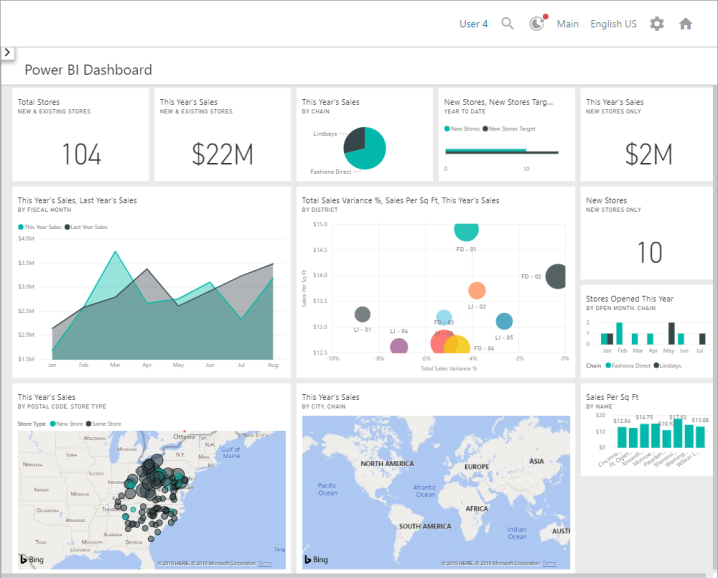
The following screenshot shows a sample Power BI screen in the Web UI displaying several Power BI tiles as part of a Power BI dashboard.
Note: Filters are only available for reports — not for dashboards.
Configuring the Power BI Screen
A Power BI screen can be configured to display Power BI reports or Power BI dashboards. For example, it can be added as a Sub Screen Tab Page on a Node Details screen if it contains product-specific reports or dashboards. If the screen is intended to display a general report or dashboard that needs no product selection, it can be accessed through a screen navigation link (e.g., from a quick link from the Web UI homepage).
Adding the Power BI Screen
The Power BI screen must be added before it can be configured as described below. The method for adding screens in the Web UI is detailed in the Design Mode Basics topic in the Web User Interfaces documentation.
Setting up the Power BI Screen
Using the Power BI screen, admin users are able to create a view from the Web UI into a published Power BI report or dashboard. The Properties window for the Power BI Screen in the Web UI designer is shown below. The parameters that appear in the screenshot are described in detail directly beneath the image. Mandatory selections are marked with an asterisk.
The Power BI screen and Power BI widget are configured in almost identical ways, with some minor exceptions. The configuration steps described below can be applied to configuring either the widget or the screen, except where expressly noted.
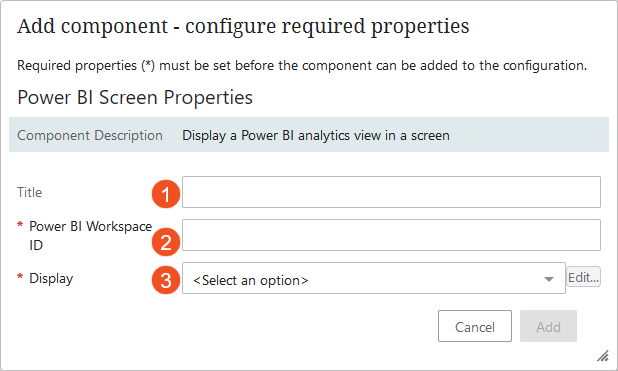
- Title: Content added to this field appears at the top of the Power BI (screen or homepage widget).
- Power BI Workspace ID: Enter the ID of the relevant Power BI Workspace. For example, b556ac84-9d9a-4af6-b569-6a770f3bbe11. For information on how to obtain this value, refer to the Locating Power BI IDs.
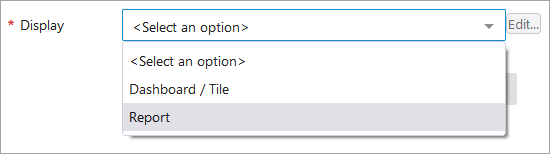
- Display: Select either 'Dashboard / Tile' or 'Report.'
Dashboard / Tile Configuration
If you are configuring your Power BI screen to display a dashboard, select Dashboard / Tile from the Display dropdown, then click the 'Edit...' button to the right of the Display field to open the Dashboard / Tile Properties designer window.
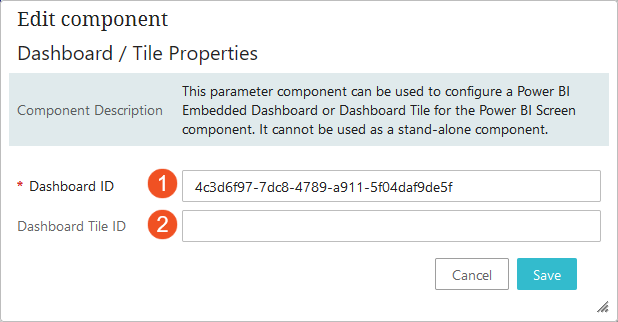
- Dashboard ID: Enter the ID of the relevant Power BI dashboard. For example, 4c3d6f97-7dc8-4789-a911-5f04daf9de5f.
- Dashboard Tile ID: Enter the ID of the relevant Power BI dashboard tile. This option will cause the Web UI screen to be composed of a single tile.
Report Configuration
If you are configuring your Power BI screen to display a report, select Report from the Display dropdown, then click the 'Edit...' button to the right of the Display field to open the Report Properties designer window.
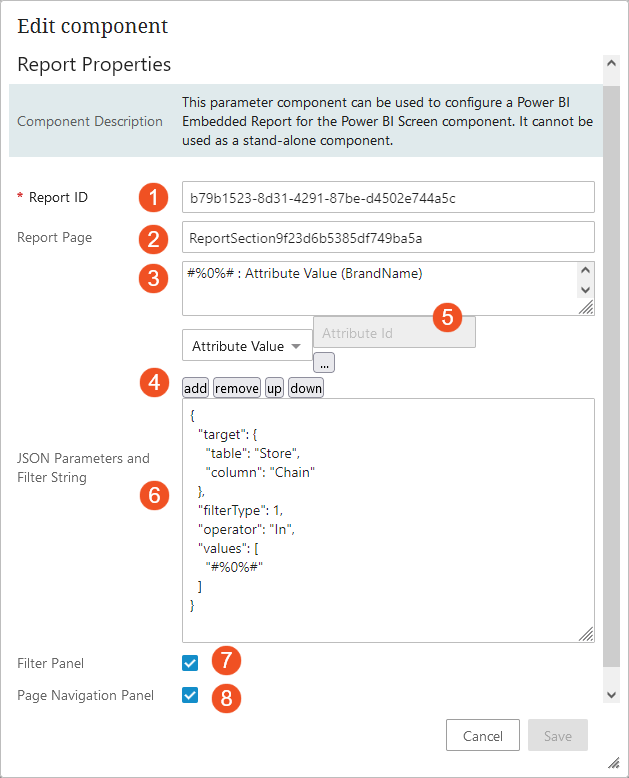
- Report ID: Enter the ID of the relevant Power BI report. For information on how to obtain this value, refer to the Locating Power BI IDs topic.
- Report Page: Enter the ID of the Power BI report page that you want to use as the first page to display when you open the report. The ID that needs to be entered can be found in the dashboard URL once the report is published.
The ID begins with the element 'ReportSection' (refer to URL example below). In the case where you want the first page of the report to display, 'ReportSection' should be entered:
https://app.powerbi.com/groups/xx/reports/xx/ReportSection?redirectedFromSignup=1
If you want to display another page, the ID format includes IDs after the 'ReportSection' element as displayed below and in the previous image:
https://app.powerbi.com/groups/xx/reports/xx/ReportSection9f23d6b5385df749ba5a?redirectedFromSignup=1
Filter Configuration Options: JSON Parameters and Filter String
This section contains two fields. The top field (3) is for JSON filter parameters. The bottom field (6) is where the JSON filter string is entered. Use these options to further limit the data that users can refer to, and/or to configure the filters that display in the optional Right Filter Panel, which is addressed in more detail later in this topic. For more information on using JSON strings to filter Power BI reports, refer to the Example Power BI Report Filters topic in this guide.
Note: To filter data based on user permissions, e.g., to ensure that the logged-in user only accesses data that is relevant to them, you must use row-level security (RLS). For more information, refer to the Power BI Row-Level Security topic in this guide.
- Filter parameters (field not individually labeled) – In this field, enter the relevant filter parameters, e.g., ‘Attribute Value.’ Each selected parameter will be assigned a placeholder string that will be replaced with a context-specific value to be referenced in the JSON query string. These placeholders also contain an embedded integer that identifies the sequence in which the parameter will appear in the filter string, e.g., #%0%# will appear first, #%1%# will appear second, etc. Moving a parameter up or down with the 'up' or 'down' button will automatically renumber the placeholder.
Note: It is recommended to generate the placeholders for the filter parameters before entering the JSON filter string in the bottom field.
- The dropdown menu below the filter parameters field allows the selection of various options to create the filter parameters. The available parameters include:
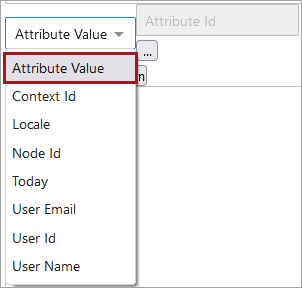
- Attribute Value: Returns / filters the view for a STEP attribute value
- Context Id: Returns the current context ID
- Locale: Returns the selected locale, which is used for the Web UI session
- Node Id: Returns the STEP ID of the current object (valid for Power BI Screen only)
- Today: Returns the current date
- User Email: Returns the email address of the logged-in user (if specified)
- User Id: Returns the user ID of the logged-in user
- User Name: Returns the name of the logged-in user
- The field directly to the right of the dropdown menu will display when either 'Attribute Value' or 'Today' is selected. If Attribute Value is selected, the ellipsis button displays (
 ). Clicking this button opens the 'Select Node(s)' window, where the relevant attribute is chosen. If Today is selected, a 'Date Format' window displays, in which the chosen date format is entered, e.g., yyyy-MM-dd. The date format uses the rules for SimpleDateFormat in Java.
- JSON filter string (field not individually labeled) – In this field, enter the desired JSON filter string. It is recommended that the string contain placeholders that correspond with the numbered dynamic values selected for the JSON filter parameters, e.g., #%0%#. #%1%#, etc.
- Filter Panel: Check this box to display a Power BI filter panel on the right side of the Web UI screen. An example is shown in the first screenshot in this topic. The filter panel is optional.
Note: Any configured filters will still apply to the Power BI report even if no filter panel is present.
- Page Navigation Panel: Check this box to display a page navigation panel on the bottom of the Web UI screen. This allows you to easily navigate between different pages of the Power BI report. An example is shown in the first screenshot in this topic.