The import functionality provides a data quality option that enables you to locate errors in the data you want to import. The functionality applies to row and column based import formats such as Excel, CSV, and FixedWidth.
For more information about the additional import steps, refer to Creating a Data Import or Creating an Inbound Integration Endpoint.
Profiling Setup
To limit the number of profiled rows and prevent out of memory exceptions, use the property Import.Profile.Max.Products in the sharedconfig.properties file. The default value for the property is 10,000. If the number of rows in the import file exceeds the limit, the remaining rows are not profiled.
Profiling Data
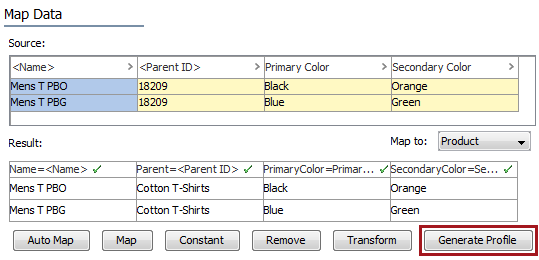
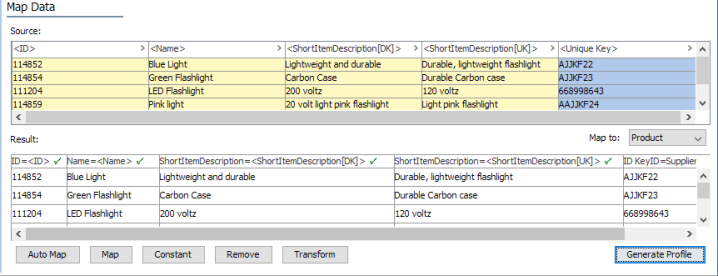
- Map all required data on the Map Data page and click the Generate Profile button to display the Import Data profile.
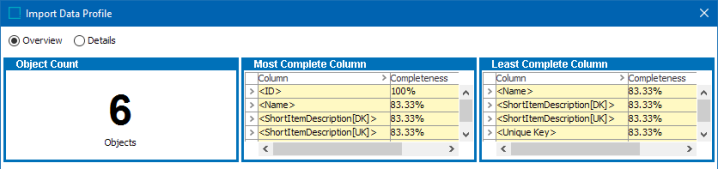
- The Import Data Profile page includes an Overview and a Details view page.
- Select the Overview radio button to display the following three widgets:
- Object Count: displays the number of profiled objects
- Most Complete: displays the 10 most complete columns
- Least Complete: displays the 10 least complete columns
Not that when you select and right-click on either the Most Complete or the Least Complete Column you will find 2 options which are shown below:
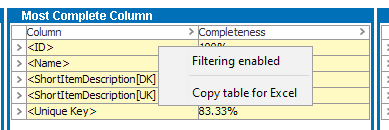
When Filtering Enabled is selected, you will get a dropdown list which allows you to filter the based on: Empty Values, Non Empty Values, Equals, Begins with, Ends with, Contains, '<' (lesser than), and '>' (Greater than) options which is nothing but a criteria. Once used, based on the criteria selected, the results will be displayed.
Similarly, when the option Copy table for Excel is selected, both the columns are selected and can be pasted in an excel sheet.
- Select the Details radio button to display a master section at the top and a details section at the bottom.
In the master section, every column of the import file is represented as a row.
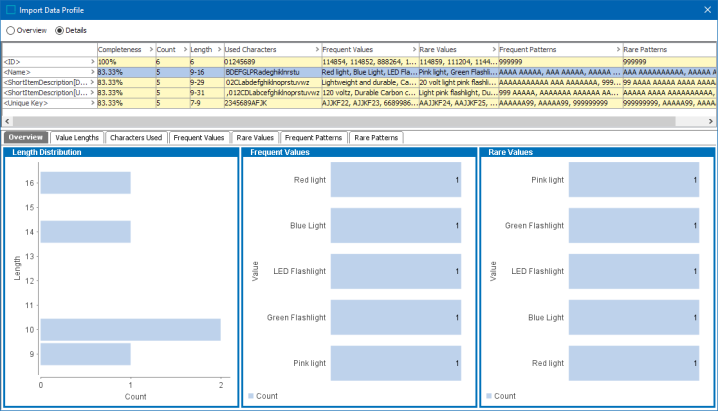
The columns in the master section contain the following information.
| Column | Description |
|---|---|
|
Completeness |
Shows the degree to which the attribute is populated in the category rounded to the nearest whole percent. Inherited values are included in the calculation. |
|
Count |
Lists the number of products below the category where the attribute has a value (including inherited values)and the number of products below the category where the attribute could possibly have a value. |
|
Used Characters |
List of the characters used for values in the column |
|
Length |
Displays value lengths, for example, 3-99 or 10. |
|
Frequent Values |
Displays a comma-separated list of the most frequently appearing values. The list is sorted ascending on frequency. |
|
Rare Values |
Comma-separated list of the least frequently appearing values. Sorted descending on frequency. |
|
Frequent Patterns |
This tab lists the most frequent patterns of the values of a given attribute together with the number values that match the pattern. The pattern describes the structure of a value. |
|
Rare Patterns |
This tab lists the least frequent patterns of the values of a given attribute together with the number values that match the pattern. The pattern describes the structure of a value. |
- Select a row in the master section to populate the details section at the bottom. The five tabs present a different view of the information that is displayed in the master section.
- Overview - Displays widgets for length distribution, frequent values, and rare values bar charts. If all values are of the same length, the length distribution bar chart is not displayed. Likewise, if only a single unique value exists in the import column, the frequent and rare values widgets are not be displayed.
- Value Lengths - Displays the number of occurrences of each value length.
- Characters Used - Displays the number of occurrences of each character.
- Frequent Values - Lists the most frequently appearing values.
- Rare Values - Lists the least frequently appearing values.
- Frequent Patterns - Lists the frequent pattern in which the values are entered
- Rare Patterns - List the most rare pattern in which the values are entered
For more information on Data Profiling, refer to the Data Profiling documentation.
On Demand Data Validation
When you map columns in the import file to data in STEP with the Data Quality functionality, the mapped data is validated on demand. The data validation status is displayed with an icon on the header of each column in the Result area of the Map Data step. Cells with validation errors are highlighted with red background color.
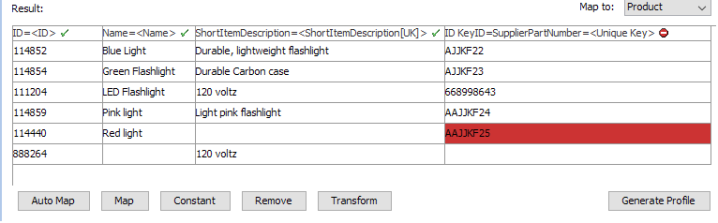
Mouse over a cell with validation errors and the hover text provides information about the problem. If you apply transformations to a result column, the validation feature is also available in the Transformation Preview. Data is re-validated with every change. Refer to the Inbound Map Data - Transform topic.
Important: Only data for the first 200 rows in the import file is validated and displayed in the result panel.
It is possible to start an import process even if validation errors have been discovered and the same errors are displayed in the background process in the execution report.