This is one of the technical infrastructure data gathering methodologies and performance recommendations for server machines. The full list is defined in the Server Environment Recommendations topic here.
The flexibility of STEP gives rise to a potentially large number of ad hoc requests between the application server and the database server. Network influence (latency) and bandwidth between the application and database servers are important because STEP performance is negatively impacted when the network latency is not stable and frequently above the latency requirements.
The ability to synchronize across the application server cluster is crucial. In an environment with two application servers, to avoid 'Optimistic Locking' errors, a data change via one application server needs to be reflected as close to instantly as possible.
Although full network recommendations are stated in the Infrastructure Recommendation document and/or Platform and Software Support document, of particular interest on this topic are:
- Network bandwidth requirements: Minimum requirement is 1 gigabit dedicated network between all STEP servers except to file servers; the recommended requirement is 10 gigabit for enterprise systems with a heavy workload profile.
- Network latency requirements: The requirements for network latency between application servers in an application cluster and between application server(s) and database server(s) are:
- Maximum 0.2 milliseconds with a 64 bytes packet size
- Maximum 0.4 milliseconds with an 8K packet size
- Maximum 1.0 milliseconds with a 32K packet size
Network latency can be analyzed using the options defined below. If network latency is not stable and/or is frequently above the latency requirements, consult your IT department for optimization.
Network Latency Analysis via STEP
From the Start Page, click the System Administration button and log in.
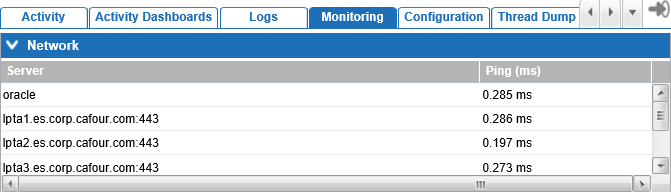
- Click the Monitoring tab to view an instant indication of the network latency between the application and database servers. This is a near real-time check of the latency between the servers. For more information, refer to the Monitoring topic in the Administration Portal documentation here.
The following example shows a network latency which is not significantly above the 0.2 milliseconds and therefore indicates a good network latency:
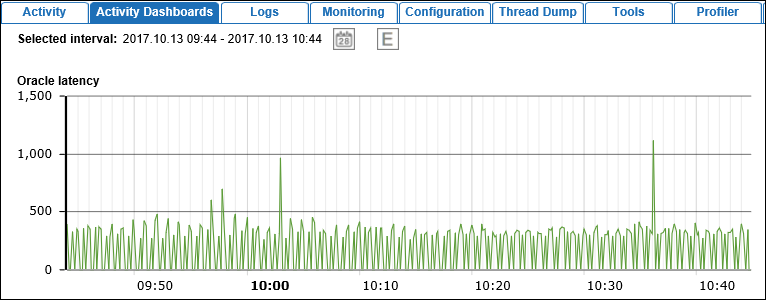
- Click the Activity Dashboard tab to view a historic network latency analysis. This graphic provides the average time it takes to execute 10 simple database requests. High latency numbers can indicate network issues, but can also indicate the database server is having trouble keeping up with the number of requests. For more information, refer to the Activity Dashboard topic in the Administration Portal documentation here.
The following images provide historic insights in the network latency:
- The time interval 'last hour' shows that latency had a couple of spikes near to the 1 millisecond, which is something to be concerned about.
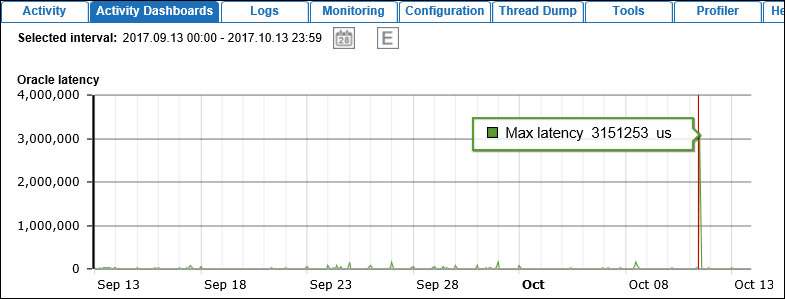
- The time interval 'last thirty days' shows a large spike around October 10 of about 3 seconds which is concerning.
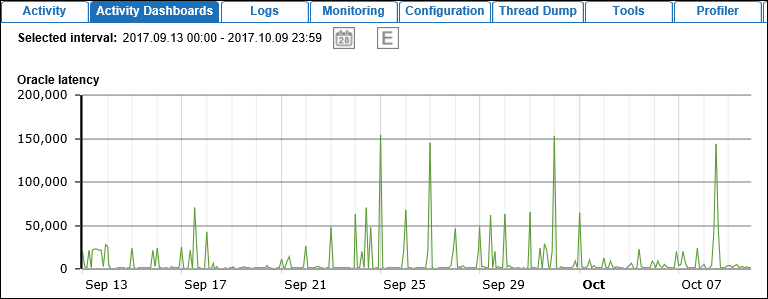
- The time interval before the spike above shows many other spikes, frequently above the 50 milliseconds, which is concerning as well.
Network Latency Analysis via Ping
Based on your type of server, use ping to measure network latency between application server(s) and database server(s) in an application cluster, as defined below.
- On a Linux server, run the following ping commands from application server to database server:
ping -c20 <db-host> |grep rtt
ping -c20 –s8000 <db-host> |grep rtt
ping -c20 –s32000 <db-host> |grep rtt
- On a Windows server, run the following hrping commands from application server to database server:
hrping -l 64 -n 20 <database-host>
hrping -l 8000 -n 20 <database-host>
hrping -l 32000 -n 20 <database-host>
Network Latency Analysis via Script
A script executed from the application server against the database and with different package-sizes can be used to measure any network latency.
- From a Linux server, log on to the application server as 'stibosw'.
- Copy the following SQL script using the file name 'benchnet5.sql' to /home/stibosw on the application server.
set timing on

set autotrace traceonly statistics
set arrays 5000
set pages 1000
select null from dual connect by rownum < 100000;
prompt Small without network influence
select null from dual connect by rownum < 100000;
set arrays 10
prompt Small with network influence
select null from dual connect by rownum < 100000;

set arrays 5000
prompt Medium without network influence
select '012345678901234567890123456789012345678901234567890123456789012345678901'||rownum from dual connect by rownum < 1000000;
set arrays 100
prompt Medium with network influence
select '012345678901234567890123456789012345678901234567890123456789012345678901'||rownum from dual connect by rownum < 1000000;

set arrays 5000
prompt Large without network influence
select '01234567890123456789012345678901234567890123456789012345678901234567890123456789012345678901234567890123456789012345678901234567890123456789012345678901234567890123456789012345678901234567890123456789012345678901234567890123456789012345678901234567890123456789012345678901234567890123456789'||rownum from dual connect by rownum < 1000000;
set arrays 100
prompt Large with network influence
select '01234567890123456789012345678901234567890123456789012345678901234567890123456789012345678901234567890123456789012345678901234567890123456789012345678901234567890123456789012345678901234567890123456789012345678901234567890123456789012345678901234567890123456789012345678901234567890123456789'||rownum from dual connect by rownum < 1000000;
- Run the script on the application server:
sqlplus stepsys/stepsys
@/home/stibosw/benchnet5.sql
- Collect all output and attach it to a Stibo Systems Service Portal issue.