The Monitoring tab is used to monitor servers and events and is divided into three sections, each of which is described below.
Network
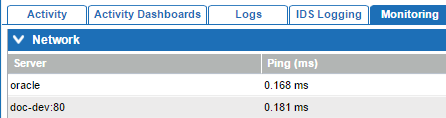
The Network section displays the latency between the servers in a STEP environment, including the database and Oracle servers, which can be useful information when troubleshooting performance issues.
Event Queue Content
The Event Queue Content section displays basic information about the event queues running on the system, accessed by clicking the Update button.
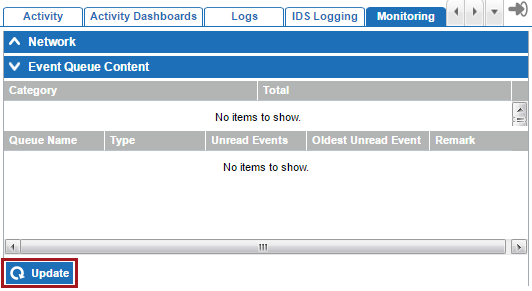
The information retrieved via Update is displayed summarily and for individual event queues.
Events are divided into two categories:
-
Disposable: Disposable events have been handled in some manner but are still retained for a period of time. If no events fall into this category, it is not displayed in the summary. Events can fall into this category in two ways. 1- Events that have occurred on the system and been processed by an event-based outbound integration endpoint or asset push for which the 'Days to Retain Events' parameter is set at something other than zero. 2- Events that were unread for an event-based outbound integration endpoint or asset push and then forwarded (skipped), but not purged.
-
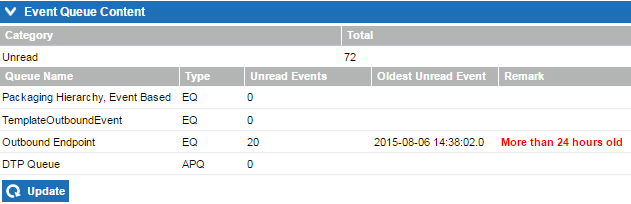
Unread: Events that have occurred on the system and are queued for handling by an event-based outbound integration endpoint, event processor, or asset push, but have not yet been processed. Events queued for handling by event processors are shown in the summary only, and not in the queued breakdown. Additionally, if event queues have been deleted but are still in the System Setup recycle bin, and had unread events prior to their deletion, those events will also be shown (until the deletion has been approved and/or purged). Therefore the total shown may not match the individual event queue totals if unread event processor events exist.
All event-based outbound integration endpoints (Type=EQ) and asset push event queues (Type=APQ) are displayed, along with the number of unread events for the queue, and the date and time the oldest unread event was generated. Typically event queues are set up to regularly process events rather than storing them on the system. Therefore, a remark is present when events have been unprocessed for more than 4 hours as this could indicate a problem with the queue.
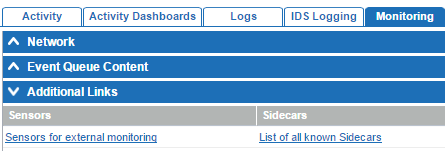
Additional Links
The Additional Links section provides links to sensors and sidecars, described below.
External Monitoring
Clicking the Sensors for external monitoring link opens another tab in the browser where all components of the STEP application are displayed. This acts as a landing page for external monitoring systems to check the status of the various components. A small example is shown below.
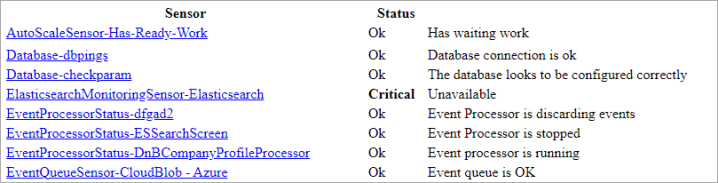
The available sensors include information on Java heap usage, http (local and remote), event queues, scheduled jobs, web services, security, and more. It is not possible to add additional custom sensors. However, not all sensors need to be monitored and users can choose to monitor only the subset that they are interested in.
Clicking on any of the sensor links provides additional information for that particular component. For example:
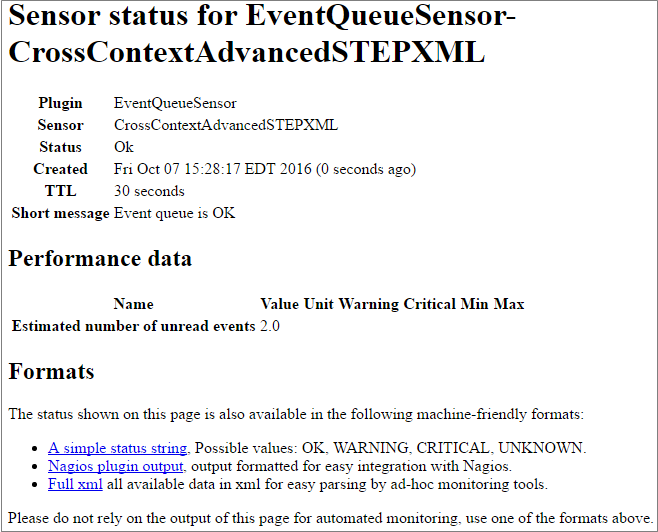
The links in the Formats section can be used to provide detailed information to an external monitoring system, which needs to call the URL that matches a format understood by the monitoring system. Custom formats can be made if the defaults are not sufficient.
Sidecars Monitoring
Clicking the List of all known Sidecars link opens the Known Sidecars page in a new browser tab. This page shows a list of sidecars configured on the system and provides links to the associated jar files, as well as links to additional status information.
For more information, refer to the Additional Asset Push Sidecar Information topic in the Digital Assets documentation.
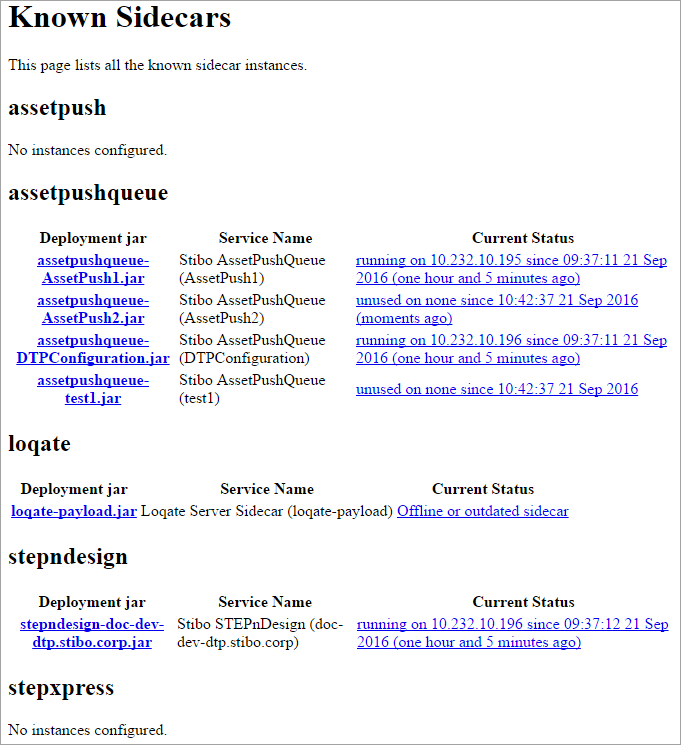
When a sidecar is first set up, STEP generates a .jar file for it. If the sidecar should be run on another system, the jar file must be downloaded and installed on the system on which it should be run. Clicking on any of the jar file links downloads the .jar file to your local machine so that it can be installed on a secondary system.
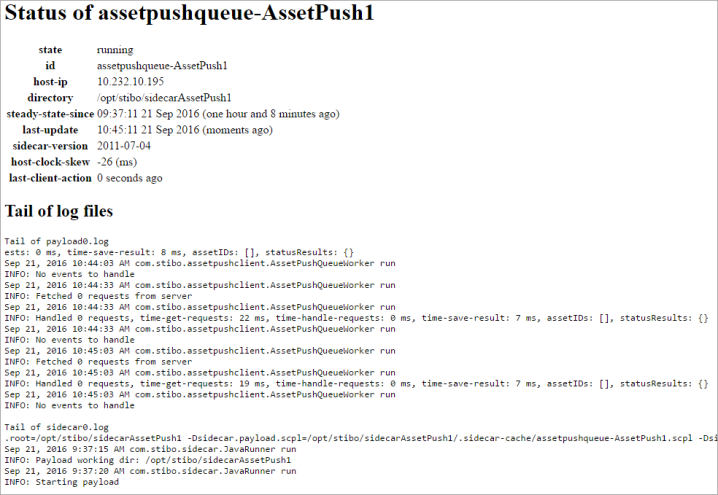
Clicking any Current Status link provides details about the sidecar, including the tail of the recent logs for the sidecar. For example: