The Financial Summary tab provides a general overview of what data will be included in an Excel-based Financial Report, which is pulled from the publication level or section level of a publication. Both the Financial Summary and the Financial Report contain information about the products, assets, and classifications that are contained either in the basket, on the actual pages, or on the planned pages that exist within the selected publication or section.
If viewing the Financial Summary from the publication level, each row contains section-level data. If viewed from the section level, each row contains page-level data. The below screenshot shows a Financial Summary as viewed from a publication with three sections.
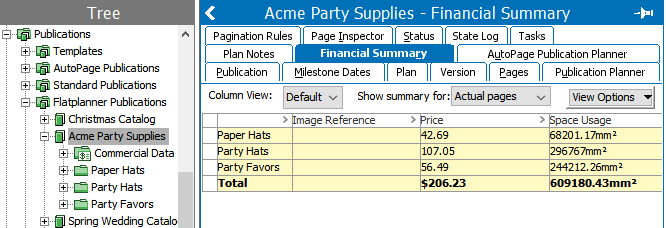
The columns available in the Financial Summary are configured by editing the column view. The columns present in the Financial Summary will, in turn, be the columns present in the Financial Report. These views can include information such as pricing and space usage. If more than one view has been created, the relevant view can be selected when configuring the Financial Report, as explained in this topic. For more information on how to configure a view for the Financial Summary, refer to the Views section of this guide here.
Note: All data may not display on the Financial Summary tab in the workbench. However, this data will be included in the extracted Financial Report.
To Create a Financial Report
Follow these steps to create a Financial Report.
Note: If your publication has multiple versions, available data from all versions will be included in the Financial Report.
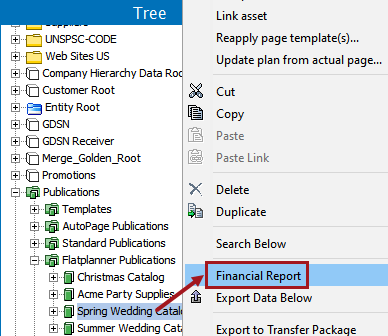
- Right-click the relevant publication or section in the publication hierarchy, then choose Financial Report.
- In the Financial Report dialog, the following configurations are available:
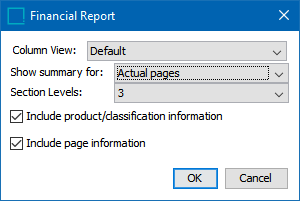
- Column View: Select the preferred column view. The available views correspond to the views that have been created for the Financial Summary.
- Show summary for: Three options are available—Basket, Planned pages, and Actual pages.
- Basket provides the data from the objects contained in the basket for the selected publication or section.
- Actual pages provides the data for DTP pages that have been saved back to STEP in the selected publication or section.
- Planned pages provides the data for the planned pages present in the selected publication or section. If available, space usage data is extracted from the actual pages.
- Section Levels: Select the number of subsection levels to include in the report. For example, if you pull the report from a publication, the publication is level 1, sections are level 2, subsections are level 3, and so forth.
- Check Include product/classification information to include the names of products and classifications on the actual or planned pages saved to the publication or section.
- Check Include page information to view the financial data per page.
- Click OK to complete the configuration of the report. The report will automatically open in Excel.