The Performance Analysis tools provide a number of useful screens, enabling administrators to analyze STEP events, activity, and results of the scheduled health checks. Only the health checks that are relevant to customers and provide actionable information to help improve system performance are included in the scheduled health checks. Some functions available within the admin portal are useful only for Stibo Systems Technical Support and/or R&D groups, while others are applicable for any system administrators.
- Monitor performance trends for opportunities to improve system performance.
- Identify whether business rule logic, data objects, and/or event handling are contributing to poor system performance.
- Troubleshoot cases where a performance impact has been observed.
The Performance Analysis tools can be accessed via the Performance Analysis link found on the Resources section of the Start Page. This separate user interface contains three analysis tools: Health checks, Activity tree, and Events. Using the 'Health checks' screen, in conjunction with the 'Activity tree' and Events graph, can help to identify slow-running processes and correlate issues with event queue activity to identify whether business rule logic, data objects, and/or event handling are contributing to poor system performance.
For a list of health checks that are scheduled to run, refer to the Healthcheck Test Index topic in the Admin Portal documentation here.
Setup Requirements
There are two configuration properties associated with the Performance Analysis tools:
-
HealthCheckScheduler.AutoRun
-
Allows the user to disable, enable, or skip the automated execution until a date in the future.
-
Possible values are 'true,' 'false,' and a date specified by the user.
-
HealthCheckScheduler.OperatingDayAndHours
-
Allows the user to schedule the start day(s) of the week, with possible values of: sun, mon, tue, wed, thu, fri, sat
-
Allows the user to schedule the start and end time of scheduled health checks, with possible values for the window of: [0-9][0-9];[0-9][0-9]
Example: sat 4-8 means that the scheduled health check analysis begins on Saturdays at 4 a.m. with the list of pre-defined health checks and stops new executions at 8 a.m. Ideally, the window size is large enough to run the scheduled health checks during that period of time.
Note: When a future date is specified, the schedule does not run until that date. Once the specified date has past, the schedule is enabled.
Once the configuration proprieties have been set, the scheduled health checks can be monitored via the Performance Analysis tools. For information on how to access the Performance Analysis tools, refer to the Accessing Performance Analysis Tools topic here.
Performance Analysis Tools
The 'Health checks', 'Activity tree,' and 'Events' tab give access to the types of performance analysis tools.
Health checks
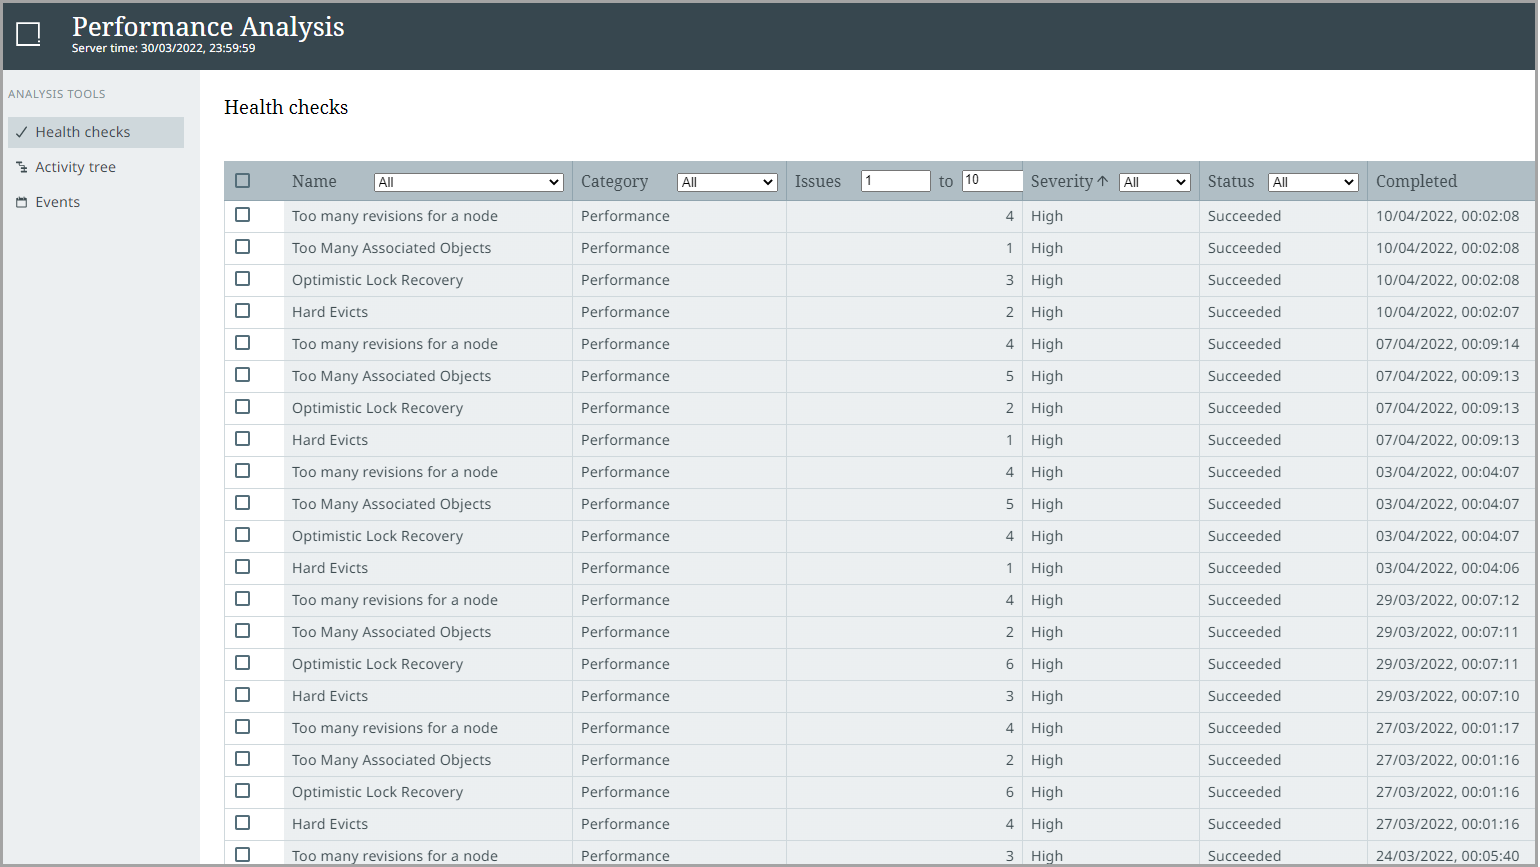
The 'Health checks' screen displays a table listing the health checks completed for the scheduled runtime, sorted by the most current execution and providing 12 weeks of history to help identify patterns over time. Taking action on the identified data and configuration issues helps prevent issues from growing to a level where the issues are more difficult to resolve.
The following is a list of the columns associated with the 'Health checks' screen:
-
Checkbox – The user can select none, one, or multiple rows. Clicking on the checkbox in the header selects all or deselects all. No further action can be taken.
-
Name – The name of the health check that has been run. This column can be filtered to display one name, or select 'All' to display all health check names.
-
Category – Displays the category of the health check. This column can be filtered for either the performance, data error, or configuration.
-
Issues – The number of issues associated with that specified health check. This column can be filtered by a minimum and maximum number of issues.
-
Severity – Displays the severity of the health check. This filterable column can show all, critical, high, or medium severity issues.
-
Status – Displays whether the scheduled health check succeeded or failed. This column can be filtered to show all, succeeded, or failed.
-
Completed – Displays the date and time in which the health check was completed.
If the user hovers next to a health check checkbox, a blue expansion arrow is shown, allowing the user to click through to obtain more detail about a specific health check:
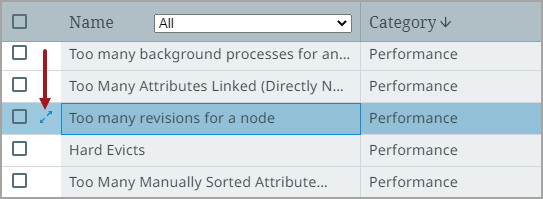
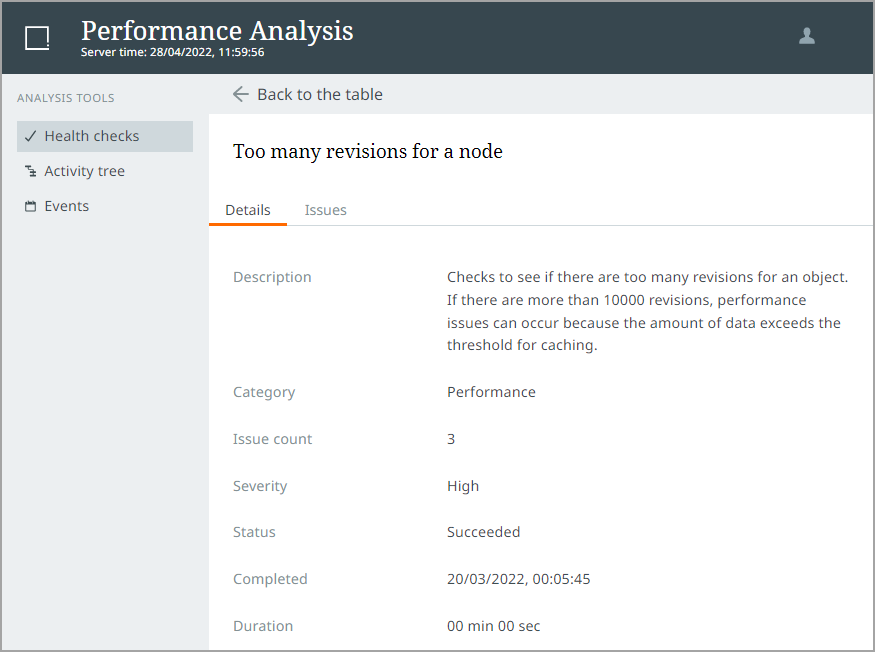
In this expanded view, more information is displayed about the health check, including a description of the check.
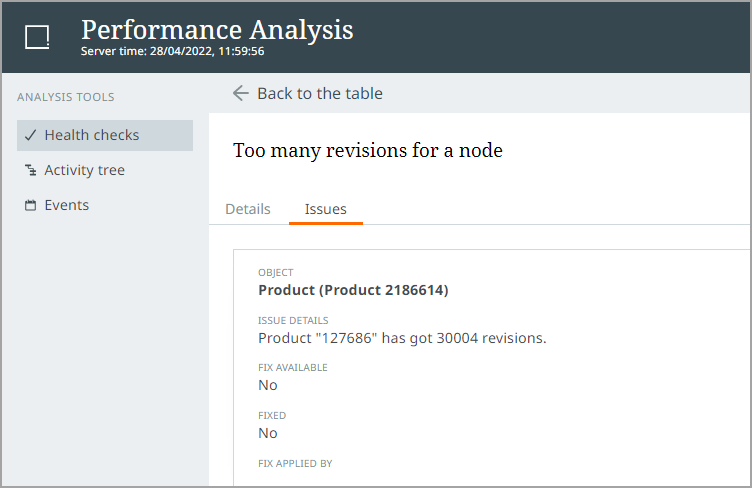
On the Issues tab, additional details about the health check are available, including object information, issue details, whether there is a fix available, if it has been fixed via Stibo Systems Support, and username of who applied the fix (if applicable).
Activity tree
In the 'Activity tree' screen, a user can investigate short-term performance issues when there is a known problem (e.g., overall system slowness, BGP not progressing, etc.) but the cause is unclear. This drill-down tree helps the user discover the problematic activity and/or process, in addition to determining the possible cause. The 'Activity tree' prioritizes items with the most activity at the top, allowing the user to review which processes are using the highest percentage of system resources.
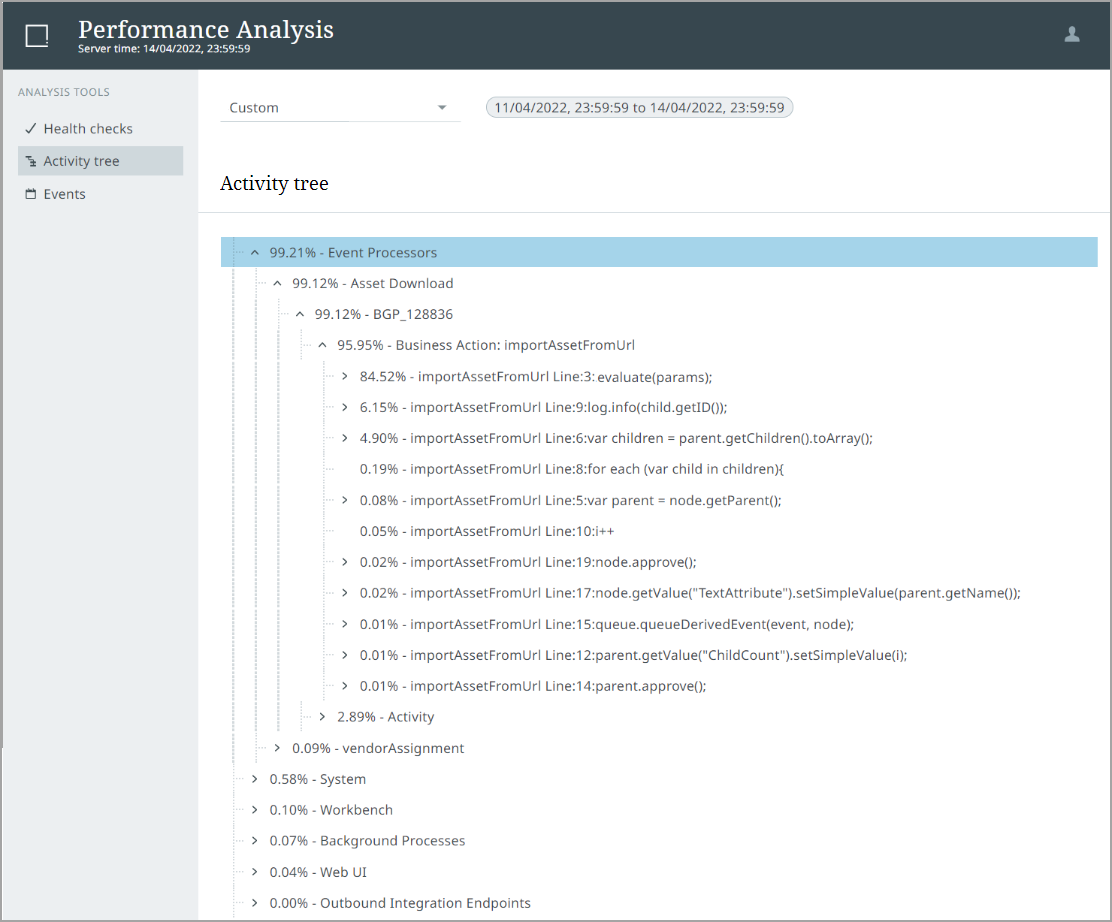
Note: The percentages detailed in the 'Activity tree' are relative to the used activity, not that all of the system resources are being used by these particular activities.
The 'Activity tree' can be run for the following time periods, allowing the user to customize the results:
-
Last 5 minutes
-
Last 30 minutes
-
Last 1 hour
-
Last 2 hours
-
Last 4 hours
-
Last 8 hours
-
Last 1 day
-
Custom
Note: The selected time period also applies to the Events screen. Alternatively, if the user selects a time period on the Events screen first, that is reflected on the 'Activity tree' screen.
Events
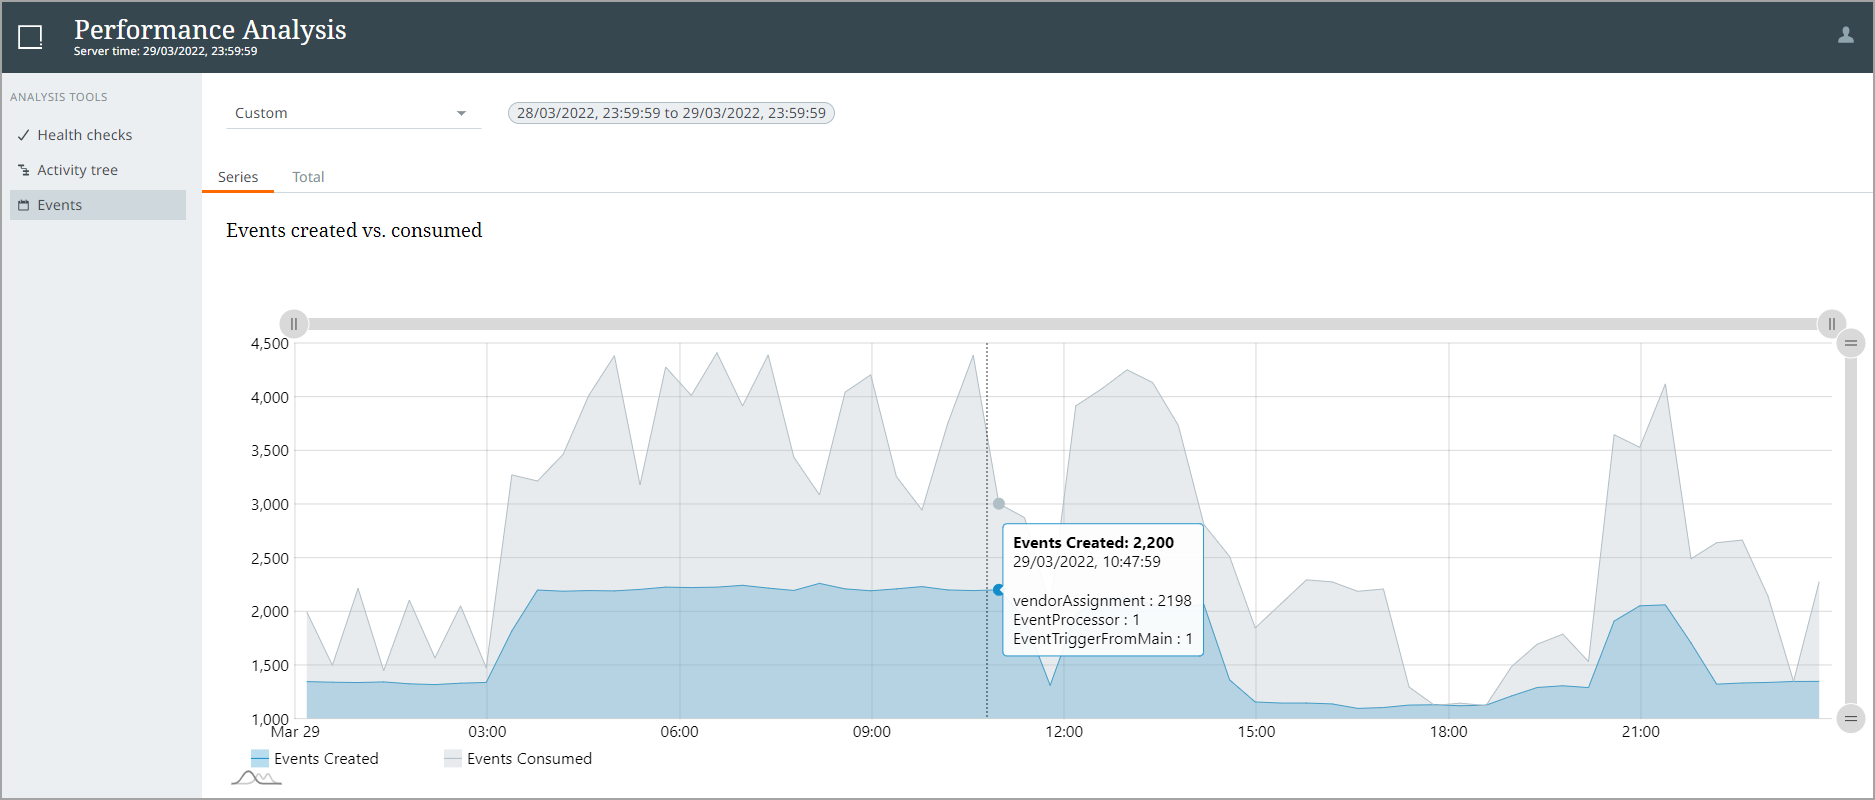
On the Events screen, the 'Events created vs. consumed' graph allows the user to visualize event processing in two ways. The Series tab allows the user to review a line graph of all the events created versus those consumed within the defined time period. Mouse-over text shows the three event queues with the highest count of events for the selected date and time.
The Total tab displays the events created versus those consumed with individual queue counts in a bar chart.
Like the 'Activity tree', the Events screen can be run for the following time periods:
-
Last 5 minutes
-
Last 30 minutes
-
Last 1 hour
-
Last 2 hours
-
Last 4 hours
-
Last 8 hours
-
Last 1 day
-
Custom
Note: The selected time period also applies to the 'Activity tree' screen. Alternatively, if the user selects a time period on the 'Activity tree' screen first, that is reflected on the Events screen.
Using Performance Analysis Tools
This is an example of how a user might benefit from Performance Analysis tools.
Consider that a system is configured to trigger an Event Processor executing a business action following the import of products, which triggers an Outbound Integration Endpoint, sending the changes to a downstream system. This flow can quickly create a high volume of events in the system, assuming the import volume is high.
The Events graph shows the rate of event creation on one line and the rate of event consumption on another line of the same graph, which shows how well the system is able to process changes. A minor phase-shift is typical between creation and consumption of events, based on schedules and execution time of the business action.
In this example, we assume the action takes more than a few seconds to execute. This could be because:
-
the action is written inefficiently
-
the action encounters objects that have a lot of children or references or values or revisions
-
there are time delays while concurrent updates to the same object in a different transaction are retried
-
or other issues.
In any of these cases, the consumption of events lags behind the creation significantly. When this occurs, the weekly executed health checks indicate issues, detailing which objects, the number of occurrences, timestamps, and the related BGP ID.
Using the information from the health checks and lag in event processing, the 'Activity tree' screen is useful to drill into an identified time frame to help indicate the configuration areas where the system is spending the most time. Exploring the 'Activity tree' for the highest percentages below the Event Processors exposes the ID of the problematic Event Processor, the BGP ID, the ID of the Business Action and the lines of code where the system is spending the most amount of time.
By combining the information in these screens, the administrator is empowered to quickly identify the contributors to performance issues, continue to research, modify and test to resolve the identified issues, which may involve rewriting a business action, adding an Event Processor to manage revisions, restructuring hierarchies, or other configurations changes, in order to optimize the system performance.