The following Performance Analysis tools are available for administrators to analyze STEP activity:
Health checks
The 'Health checks' screen displays a table listing the health checks completed for the scheduled runtime, sorted by the most current execution and providing 12 weeks of history to help identify patterns over time. Taking action on the identified data and configuration issues helps prevent issues from growing to a level where the issues are more difficult to resolve.
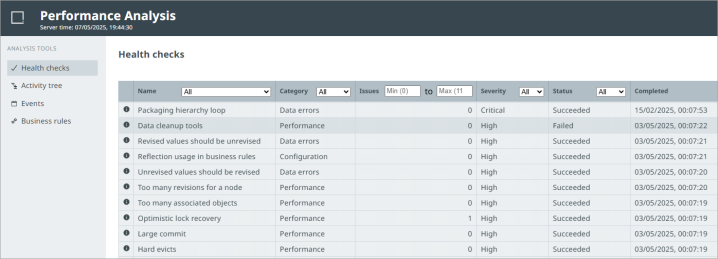
The columns on the 'Health checks' screen include:
-
 – Click the information icon to display an expanded view dialog (defined below) with more detail about a specific health check including a description of the check.
 -
Name – The name of the health check that has been run. This column can be filtered to display one name or select 'All' to display all health check names.
-
Category – Displays the category of the health check. This column can be filtered for either the performance, data error, or configuration.
-
Issues – The number of issues associated with that specified health check. This column can be filtered by a minimum and maximum number of issues.
-
Severity – Displays the severity of the health check. This filterable column can show all, critical, high, or medium severity issues.
-
Status – Displays whether the scheduled health check succeeded or failed. This column can be filtered to show all, succeeded, or failed.
-
Completed – Displays the date and time in which the health check was completed.
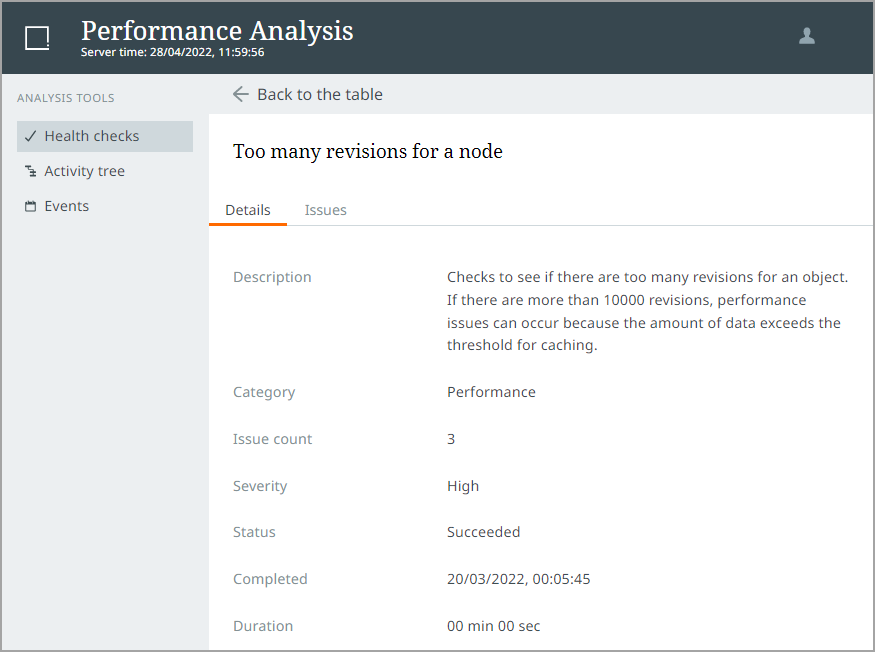
The default expanded view dialog displays the Details tab with information about the health check.
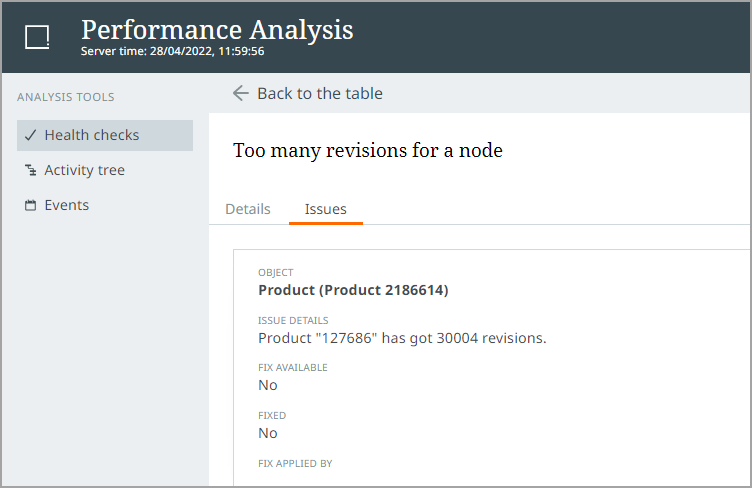
On the expanded view Issues tab, available details include object information, issue details, whether there is a fix available, if it has been fixed via Stibo Systems Support, and username of who applied the fix (if applicable). Not all health checks have information on the Issues tab.
Activity tree
In the 'Activity tree' screen, a user can investigate short-term performance issues when there is a known problem (for example, overall system slowness, BGP not progressing, etc.) but the cause is unclear. This drill-down tree helps the user discover the problematic activity and/or process, in addition to determining the possible cause. The 'Activity tree' prioritizes items with the most activity at the top, allowing the user to review which processes are using the highest percentage of system resources.
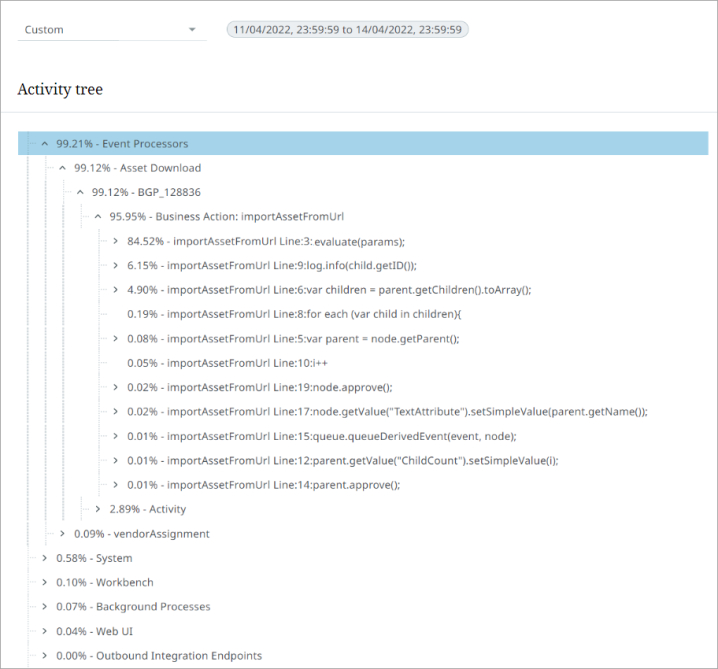
Note: The percentages detailed in the 'Activity tree' are relative to the used activity, not that all of the system resources are being used by these particular activities.
Available time periods
The 'Activity tree' can be run for the following time periods, allowing the user to customize the results:
-
Last 5 minutes
-
Last 30 minutes
-
Last 1 hour
-
Last 2 hours
-
Last 4 hours
-
Last 8 hours
-
Last 1 day
-
Custom
Note: The selected time period also applies to the Events screen. Alternatively, if the user selects a time period on the Events screen first, that is reflected on the 'Activity tree' screen.
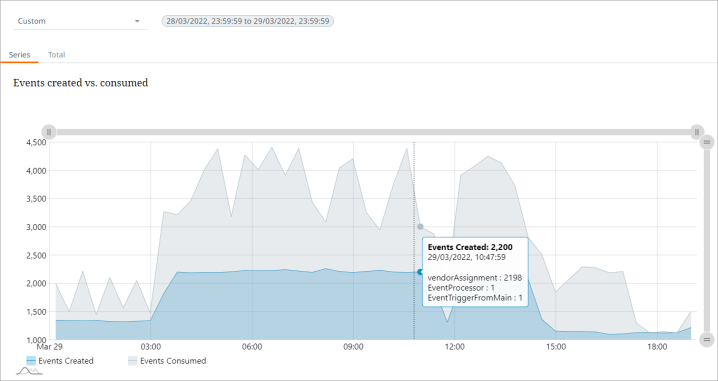
Events
On the Events screen, the 'Events created vs. consumed' graph allows the user to visualize event processing in two ways. The Series tab allows the user to review a line graph of all the events created versus those consumed within the defined time period. Mouse-over text shows the three event queues with the highest count of events for the selected date and time.
The Total tab displays the events created versus those consumed with individual queue counts in a bar chart.
The Events screen can be run for the same time periods as the 'Activity tree'.
Note: The selected time period also applies to the 'Activity tree' screen. Alternatively, if the user selects a time period on the 'Activity tree' screen first, that is reflected on the Events screen.
Business Rules
On the Business Rules screen, potentially problematic business rules can be identified, based on the time they take to run, the transaction size, and objects cached. Data is displayed for all business rules run during the selected time period unless they have been removed from System Setup. This information is also available in the JS Log as defined in the Logs topic of the Administration Portal documentation.
The same time periods are available on this screen as are on the 'Activity tree'.
The 'Download as Excel' button creates an Excel file containing all data in the table.
Click the column headers to sort the data.
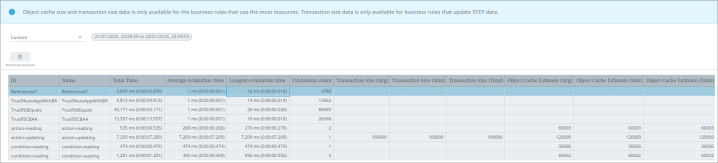
Note: The 'objects' being reported are low-level database elements, not actual products, entities, or other common STEP elements. Analyze the business rules relative to each other, consider improvements for the business rules with larger numbers for each data category (time and objects).
The data includes:
-
ID and Name of the business rule
-
Total Time - milliseconds and standard time (hours:minutes:seconds.milliseconds) spent running the business rule
-
Evaluation Time - average / longest time spent evaluating objects while running the business rule
-
Transaction Size - average / maximum / total number of objects modified in the transaction. This is only available for business rules that update STEP data.
-
Object Cache Estimate - average / maximum / total estimated number of objects cached during the transaction
Object cache size and transaction size data is only available for the business rules that use the most resources due to:
-
a dynamic threshold, adjusted regularly, starting at 100,000 objects cache / 10,000 objects transaction sizes.
-
a hard lower limit of 10,000 objects cache / 1,000 objects transaction size.
The availability of historical data varies based on environment configuration and the level of activity. The message 'There were no results for your selection' is displayed for time periods with no activity, for example, due to maintenance, off-work hours, or because the source data is no longer available.