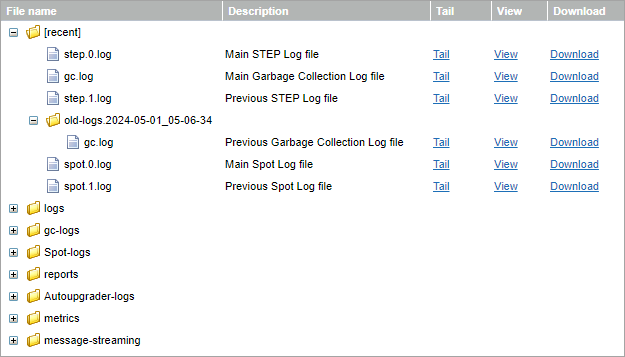
The Logs tab provides access for users to view and download the system logs, using the Fetch data button to retrieve the information. In a clustered environment, each available server is listed for selection in the dropdown.

Fetching the data displays the most recently accessed log files, followed by drill down options for accessing additional logs.

Several properties in the sharedconfig.properties file can be adjusted to control logging functionality. Among other things, these properties allow specifying where to store particular logs on the application server, how many old log files to retain, and the level of logging that should be employed across the system and/or for particular components. The relevant properties are identified by 'Log' and 'Admin' prefixes (e.g., Log.Count, Log.Level, Admin.TailSize, etc.).
Note: Log files are automatically included in diagnostics packages sent to Stibo Systems. For more information on sending diagnostics, refer to the Send Diagnostics topic.
Log Types
Logs are stored based on their type as defined in the following sections.
Logs
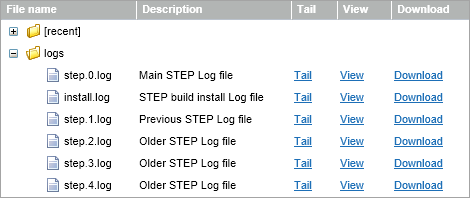
The logs folder includes the main STEP logs (step.X.log) and the install.log file, which lists all prepared and installed recipes on the system.

The STEP log files are used primarily for system monitoring and troubleshooting and contain a large amount and variety of information, including stack trace information for errors and exceptions not handled by the GUI. The zero log (step.0.log) is the current log, with older log files indicated by incrementing integers.
The install.log is especially useful in determining the current build / patch applied to any system. It contains a list of all recipes that have been applied to the system, in sequential order.

Trace
When business rule tracing is enabled, the trace folder contains the logs for business rules tracing. This functionality is enabled on the Tools tab and is described within the Tools topic. The trace files follow the same format as the main STEP logs where the zero log (trace.0.log) is the current log, with older log files indicated by incrementing integers. The zero log will be empty and no additional log files will appear if business rules tracing has not been enabled.
JS Logs
JavaScript business rules log messages to the files stored in the js-logs folder. Log entry severity levels can be indicated within the JavaScript code (as defined in the Logger Bind topic); however, the environment type determines which log entries are reported by default:
-
Test and Development environments log INFO, WARNING, and SEVERE entry severity levels.
-
Production environments only log SEVERE entry severity levels.
For a given environment, set the JavaScript.Logging.LogLevel property to override the default behavior and chose the appropriate log level.
GC Logs
The gc-logs folder contains the garbage collector log files, following a similar format as the main STEP logs where the current log is gc.log.0.current, and older log files are indicated by incrementing integers.

Beyond the current log file, the garbage collection logs are organized in subfolders by date. The garbage collector log files are used primarily when a system is reporting out of memory and/or heap space errors as they can be useful in these cases to identify where the system is spending time in garbage collection.
SPOT Logs
The Spot-logs folder contains logs with information about patch deployment and start-up. This allows admins to troubleshoot issues when deploying a custom add-on developed using the Extension API.

Message-Streaming Logs
When the MessageStreaming license is applied, access to the Kafka Streaming Receiver in inbound integration endpoints (IIEPs) is granted and message-streaming logs include execution report detail. For more information, refer to the Kafka Streaming Receiver topic in the Data Exchange documentation.
Viewing Options
Users have three options for viewing any of the log files:
-
Tail: Displays a truncated version of the log file (with only the most recent content) in a new tab in the browser. The amount of data displayed is defined by the Admin.TailSize property in the sharedconfig.properties file (or Admin.TailSizeNoSession property, if applicable).
-
View: Displays the complete content of the log file in a new tab in the browser.
-
Download: Downloads the complete file to your local machine. This can be used when the information needs to be sent to Stibo Systems for analysis and troubleshooting on systems to which Stibo Systems does not have direct access. However, log files are also included when using the Send Diagnostics tool, which is the preferred method for sending information to Stibo Systems as it does not require users to determine which individual files are relevant to send. For more information on sending diagnostics, refer to the Send Diagnostics topic.