The visual integration with Power BI supports row-level security (RLS) as a way to restrict data access for specified users. Like in STEP, users can be given 'super user' privileges in Power BI that allow them to view all information in reports, dashboards, and tiles, while other users can be set up with more limited permissions that allow them to view only specified subsets of information.
This topic provides an example setup of row-level security applied to data from two fictional retail chains (Lindseys and Fashions Direct), how to set up users and permissions in Power BI through the Power BI Desktop application, and how to set up corresponding users and groups in the workbench.
The following considerations apply to configuring row-level security for Power BI:
- To configure row-level security, roles and rules must be defined within the Power BI Desktop application; they cannot be defined from within the Web UI or by logging into Power BI (via https://app.powerbi.com).
- The Power BI Desktop application is only available for the Windows platform. For more information on Power BI Desktop, including download access, refer to https://powerbi.microsoft.com/desktop.
For more detailed information from Microsoft on how to configure row-level security for Power BI, refer to the following topics:
- Row-level security with Power BI Embedded: https://docs.microsoft.com/en-us/power-bi/developer/embedded-row-level-security
- Row-Level security (RLS) with Power BI: https://docs.microsoft.com/en-us/power-bi/service-admin-rls
Overview of Row-Level Security in Power BI
Row-level security in Power BI is enforced by filters that are applied in Power BI to restrict data. Three main concepts are used to configure row-level security in Power BI: users, roles, and rules.
- Users: The end users that view the artifact (dashboard, tile, or report). After configuring Power BI authentication, users will be automatically authenticated with Power BI when viewing Power BI data in the Web UI. For more information, refer to the Power BI Authentication Configuration topic.
- Roles: Users belong to roles. A role is a container for rules and can be named something like Sales Representative or Sales Manager.
- Rules: Row-level security is defined within the roles. Roles have rules, and these rules are the actual filters that are applied to the data. The rules can be as simple as 'Country = Canada' or something more complex.
From a STEP perspective, when row-level security is applied, the Power BI user for which STEP requests an access token will be the STEP user ID of the currently logged in user. The Power BI roles that the user belongs to will correspond to the STEP user group IDs that the user is a member of.
Example Row-Level Security Setup
The following example uses a 'Retail Analysis Sample' data model to outline the steps for setting up row-level security in Power BI. These steps include:
- Create roles and rules in Power BI Desktop
- Publish the data to Power BI
- Set up users and groups in the workbench
- Confirm filtering in Web UI
Note: These instructions describe a high-level overview of a sample setup that includes fictional retailers and users. For more information on how to navigate the Power BI Desktop interface itself, as well as how to configure a solution that is a fit for your specific business needs, refer to the 'Row-level security (RLS) with Power BI' topic in the Power BI help documentation: https://docs.microsoft.com/en-us/power-bi/service-admin-rls.
Create Roles and Rules in Power BI Desktop
Before these steps can be carried out, you must first download the Power BI Desktop application, which is only available for the Windows platform. For more information, refer to https://powerbi.microsoft.com/desktop.
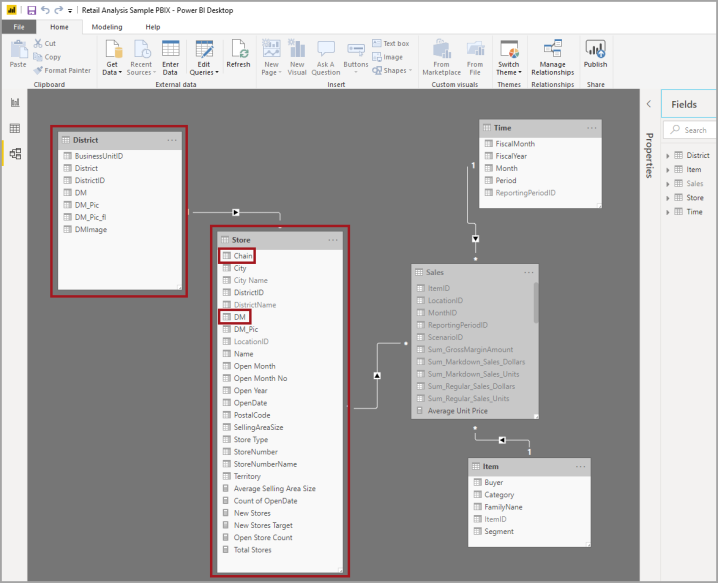
- The below screenshot shows the Power BI Desktop interface with five database tables displayed. This example uses information from the 'District' and 'Store' tables, with a focus on the 'Chain' and 'DM' (district manager) columns from the Store table.
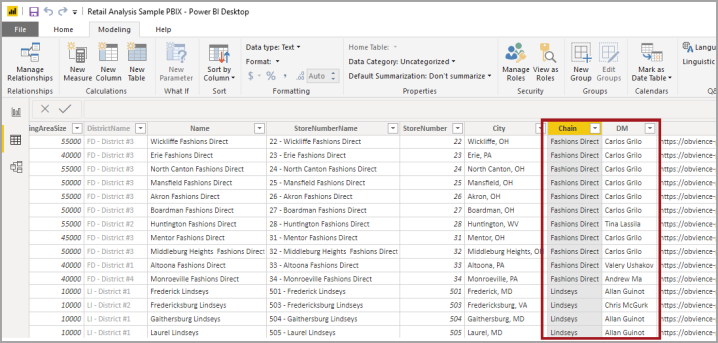
The next screenshot shows more details about the Store table, with the Chain and DM columns highlighted. The Chain column contains the names of the two fictional retailers (Fashions Direct and Lindseys), and the DM column contains the names of the fictional district managers.
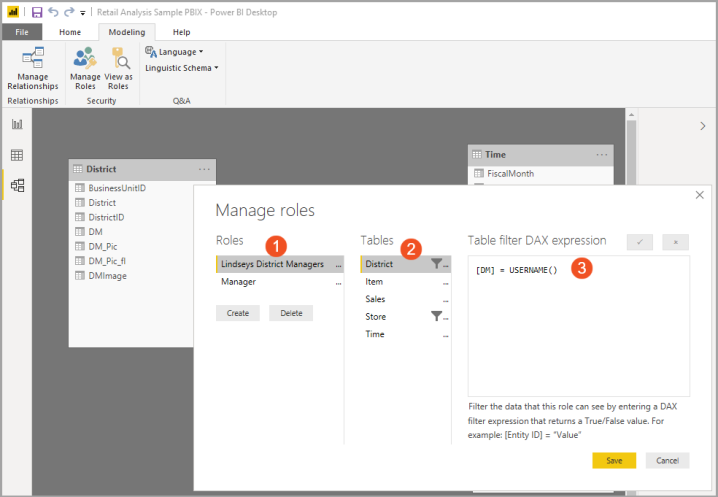
- The first role created for this example setup is 'Lindseys District Managers' (step 1 in the below screenshot).
The first rule created for this role is to match DM to username. Select the District table (step 2), then match DM to username by entering the [DM] = USERNAME() string into the Table filter DAX expression field (step 3). The STEP user ID will be passed to Power BI in such a way that it can be accessed via the USERNAME() function.
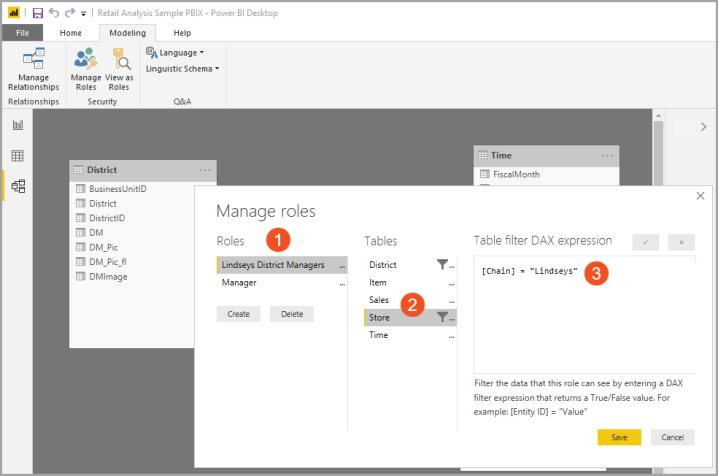
- The second rule created for Lindseys District Managers (step 1 in the below screenshot) is to match Chain to the name of the relevant store chain (Lindseys).
Select the Store table (step 2), then match Chain to Lindseys by entering the string [Chain] = "Lindseys" into the Table filter DAX expression field (step 3).
Later in the configuration, a corresponding STEP user group will be created named 'Lindseys District Managers.' The ID of the group defined in STEP is passed across and is used to match the Name of the role in Power BI. The two rules defined in the preceding steps will ensure that if a user is part of the 'Lindseys District Managers' group in STEP, and their username matches the DM field, they will only access data applicable to Lindseys and their user ID.
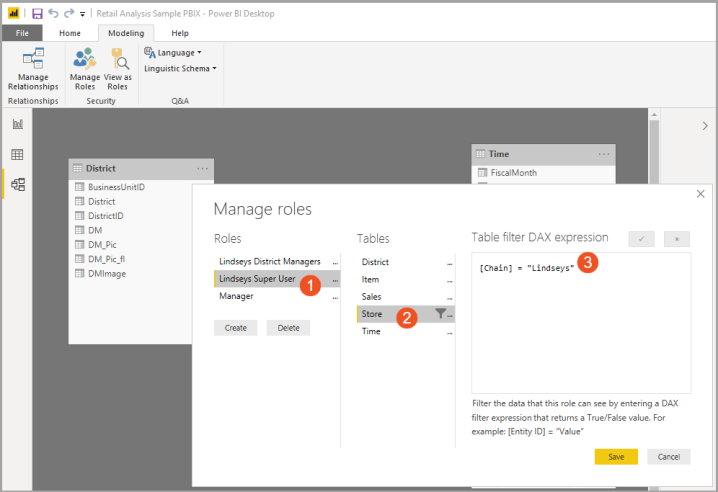
- The next role created for this example setup is 'Lindseys Super User' (step 1 in the following screenshot).
Create a rule to match Chain to Lindseys by selecting the Store table (step 2), then enter the string [Chain] = "Lindseys" into the Table filter DAX expression field (step 3).
This rule ensures that anyone who is part of the Lindseys Super User group will be able to examine all Lindseys-specific data, regardless of their user name (i.e., there is no filtering on user name applied).
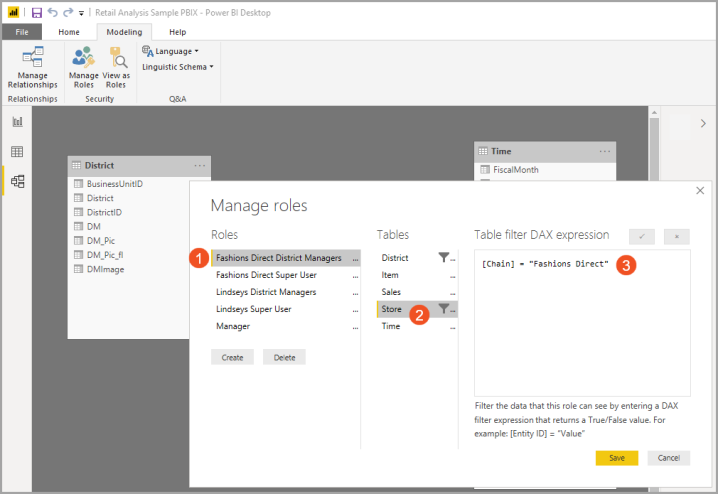
- Next, create the 'Fashions Direct District Managers' role (step 1 in below screenshot).
Create a rule (not pictured in the below screenshot) to match DM to username for users within the Fashions Direct District Managers group by selecting the District table, then entering the [DM] = USERNAME() string into the Table filter DAX expression field.
Create a second rule to match Chain to Fashions Direct by selecting the Store table (step 2), then entering the string [Chain] = "Fashions Direct" into the Table filter DAX expression field (step 3).
These rules ensure that if a user is part of the 'Fashions Direct District Manager' STEP user group, and their username matches the DM field, they will only examine data applicable to 'Fashions Direct' and their user ID.
- Create a 'Fashions Direct Super User' role in a similar way how the 'Lindseys Super User' group was created, including a rule to match Chain to Fashions Direct by selecting the Store table, then entering the string [Chain] = "Fashions Direct" into the Table filter DAX expression field.
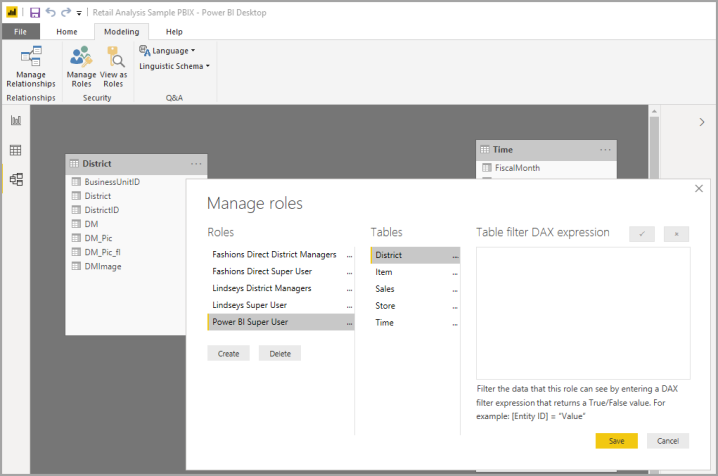
- Last, create a 'Power BI Super User' role that has no filtering set on any of the tables. Anyone with this role will be able to examine all data completely unfiltered.
- Click Save to store the Power BI pbix file (Power BI Desktop report) to your computer. You will upload (publish) this file to Power BI to continue the setup.
Publish the Data to Power BI
- Log in to Power BI via https://app.powerbi.com.
- Select the Power BI workspace to upload the Power BI report with RLS.
- Click 'Get data,' then select Local File.
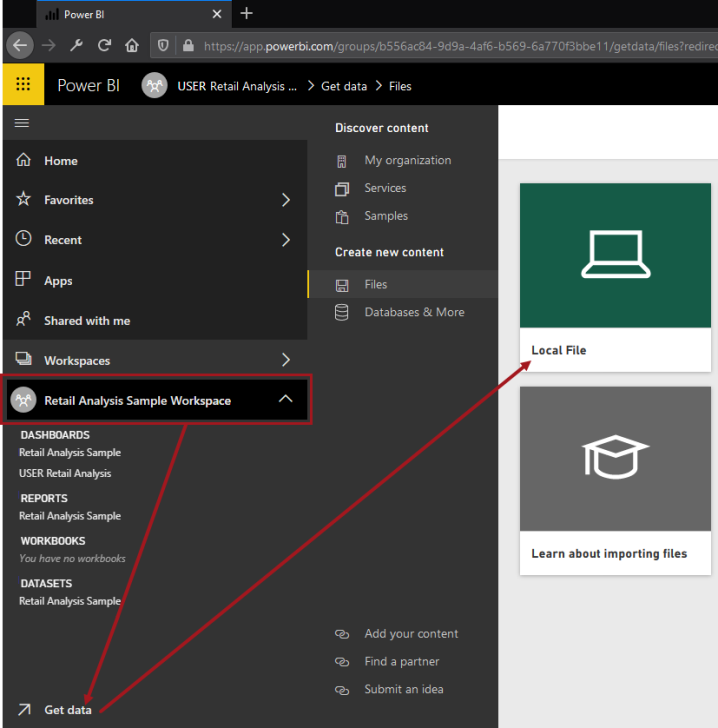
- Upload the pbix file that you previously saved. This will upload the dataset, report, and dashboard to Power BI.
Note: The dashboard will probably be empty, so you will need to add tiles to it yourself. Refer to https://docs.microsoft.com/en-us/power-bi/service-dashboards for more information.
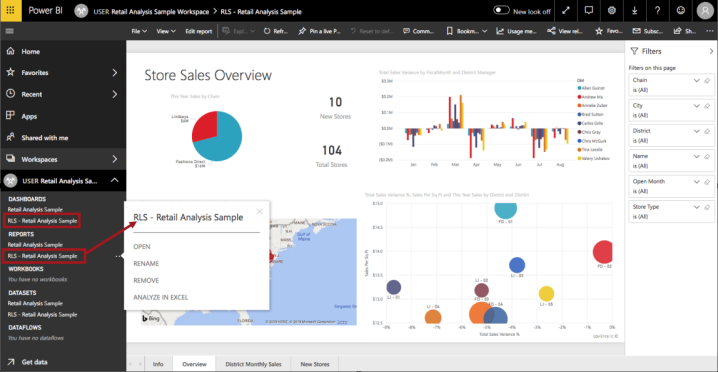
- You now have a workspace with multiple dashboards / reports. In the below example, the RLS-enabled Power BI dashboards and reports are prefixed with RLS. The ones without the prefix do not have RLS applied.
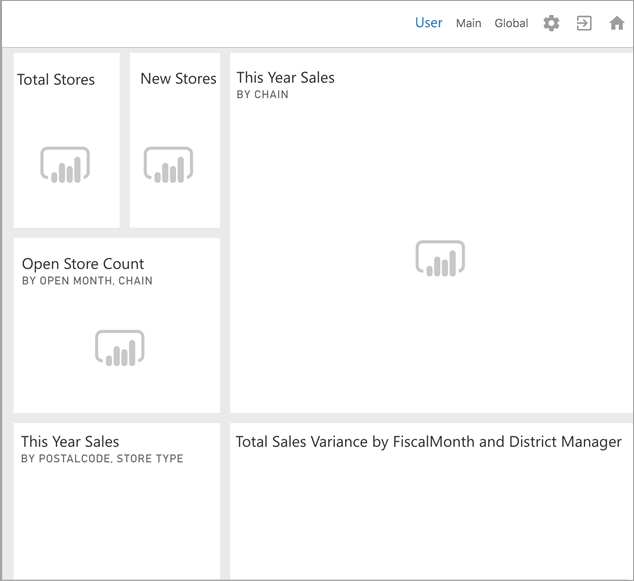
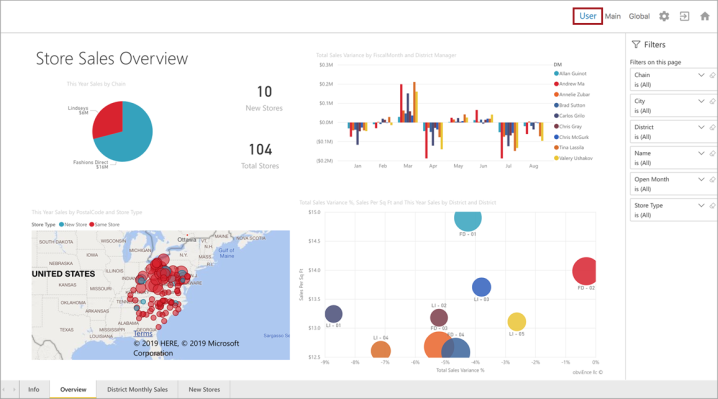
At this point, no corresponding users and user groups have been set up in STEP, so there are no roles that Power BI understands. Therefore, no Power BI information will display in the Web UI. For example, if you log into the Web UI and attempt to view a Dashboard with RLS applied, it will look like the following screenshot:
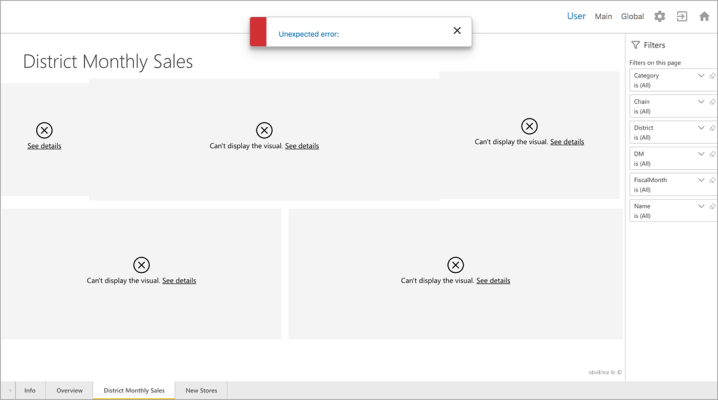
If you attempt to view a Report with RLS applied, it will look like the following screenshot. This is because the logged-in user is not part of any role that Power BI understands, so Power BI has nothing to display.
Set Up Users and Groups in STEP Workbench and Confirm Filtering in Web UI
The following steps in this example setup explain a recommended practice for creating users and groups in STEP that correspond to the users and roles created in Power BI Desktop in this topic.
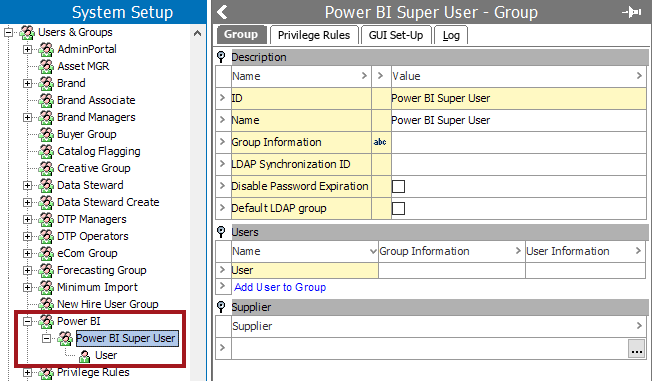
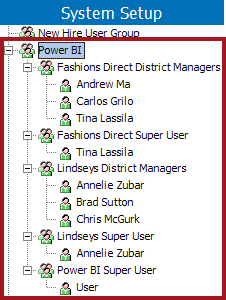
- In the workbench, create a 'Power BI' user group, then create a group beneath it with the ID 'Power BI Super User.' Add the relevant Power BI super user(s) to this group, e.g., 'User.'
Note: This is not a hard-coded user group ID; the ID just has to match with the name of the role that has been created in Power BI.
- Log into your Web UI as 'User.' The previously failing report / dashboard should now show the full unfiltered data because 'User' is part of the Power BI Super User group.
- Next, create the following users and groups:
- Fashions Direct District Managers (Andrew Ma, Carlos Grilo, Tina Lassila)
- Fashions Direct Super User (Tina Lassila)
- Lindseys District Managers (Annelie Zubar, Brad Sutton, Chris McGurk)
- Lindseys Super User (Annelie Zubar)
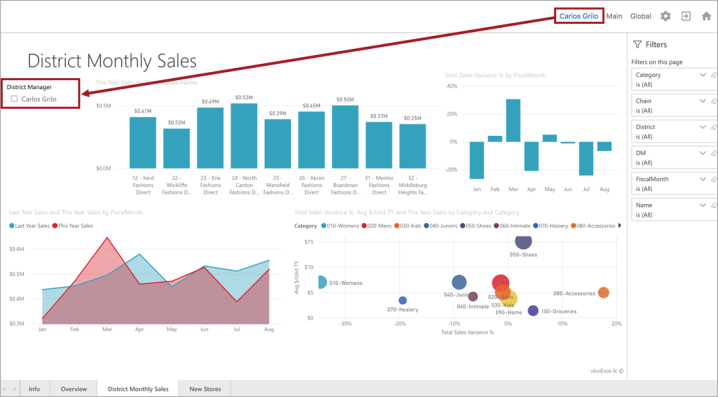
- Log into the Web UI with one of the previously created district manager users, e.g., Carlos Grilo, who is a member of the Fashions Direct District Managers group. Power BI will filter everything appropriately.
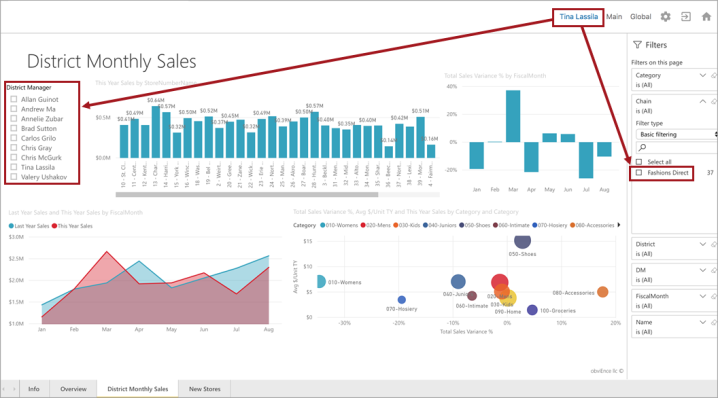
- Log in with a Fashions Direct super user to examine more data. e.g., Tina Lassila, who is a member of both the Fashions Direct District Managers and Fashions Direct Super User groups. If Tina were only in the Fashions Direct District Managers group, they would only access data filtered on their username. But, since they are also a member of the Fashions Direct Super User, Tina is entitled to access all Fashions Direct data.
- Finally, log in with a Power BI Super User and check that you can examine both Fashions Direct and Lindseys data.
