The global dashboard is a highly customizable view that allows users to display profiled data using a collection of configurable widgets. Multiple dashboards can be configured to display the most relevant data for specific user groups. Additionally, widgets can be configured to display data from specific category / data profiles. This allows users to view profile information without having to navigate through the Tree to locate the relevant profile.
Displaying the Global Dashboard
- To view the dashboard, click the STEP logo icon in the upper left corner of the workbench.
![]()
- From the Show Dashboard for User Group list, select a user group you belong to view their dashboard.
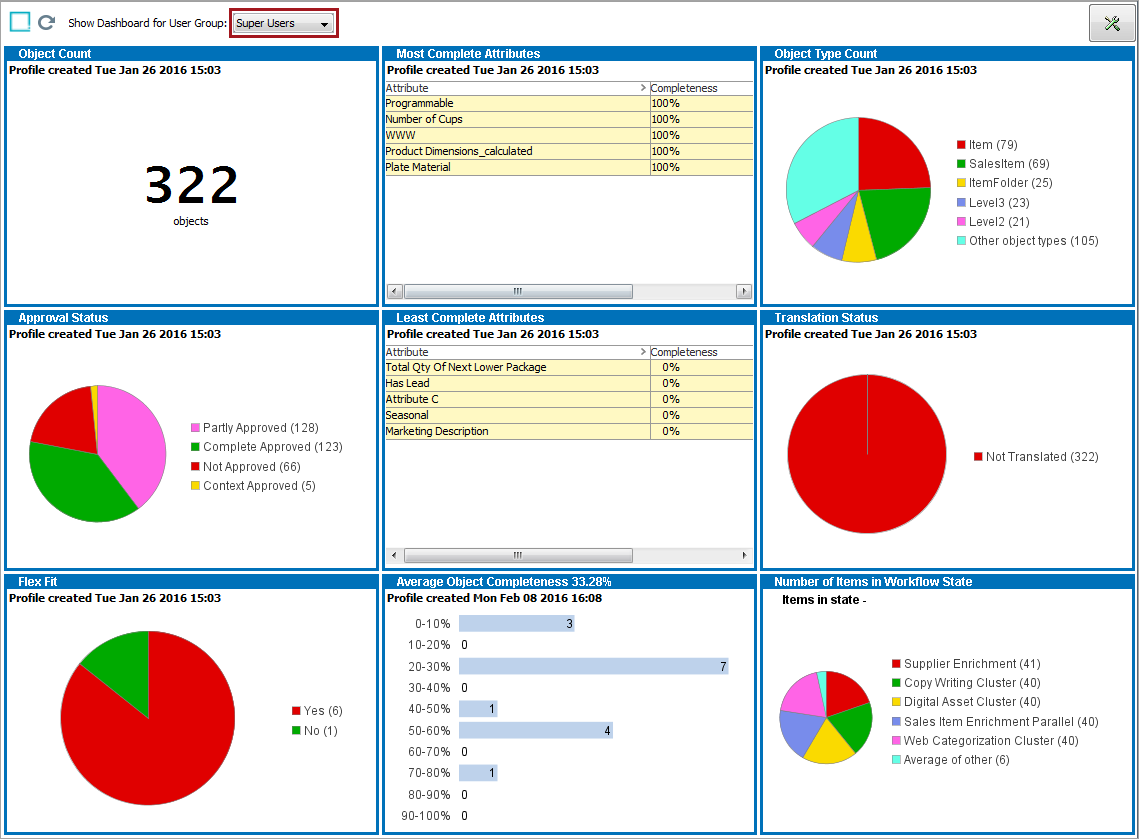
Customizing the Global Dashboard
- On the Global Dashboard, select the preferred User Group, and then click the Tools icon
 . The configuration view of the dashboard is displayed. Note that the upper half of the view displays the available widgets, and the lower half is a preview of the dashboard. Adding these widgets to the dashboard is detailed in Step 3 below.
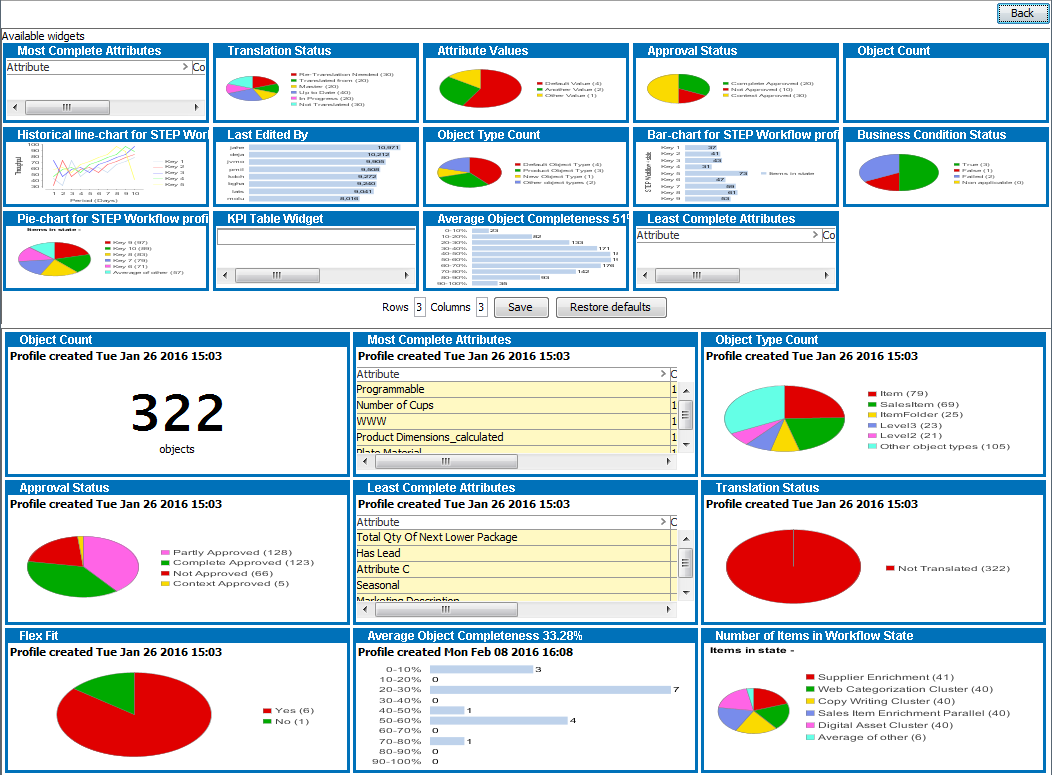
- In the Rows and Columns fields, located between the available widgets and dashboard preview areas, specify how many rows and columns you want on the dashboard.

- Configure the widgets for the currently selected dashboard:
- To add a widget, left-click the header bar of the preferred widget and drag the widget to an empty area in the preview.
- To remove a widget, in the preview, right-click the header bar of the widget you want to remove, and then select Remove.
- To resize a widget, in the preview, right-click the header bar of the widget you want to re-size, mouse over Width or Height, and select the preferred value.
- To configure what data is displayed, in the preview, right-click the header bar of the applicable widget, and then select Setup.
For more information about configuring specific widgets, refer to the Available Widgets section of the Data Profiling documentation here.
The main difference between configuring widgets for the global dashboard and for category /data profiles is that for each widget the user must specify which category / data profile to draw data from. The Workflow Profile widgets are specific to the global dashboard and are detailed below.
- Once the dashboard has been configured, click Save and then click the Back button at the top to return to the main global dashboard view.
- Click the Refresh icon
 for the changes to take effect.
Workflow Profile Widgets
Like the other widgets, the Workflow Profile widgets need to be configured to display the desired data.
Bar-chart for STEP Workflow Profile
This widget displays data for any available Workflow Profile in a bar graph.
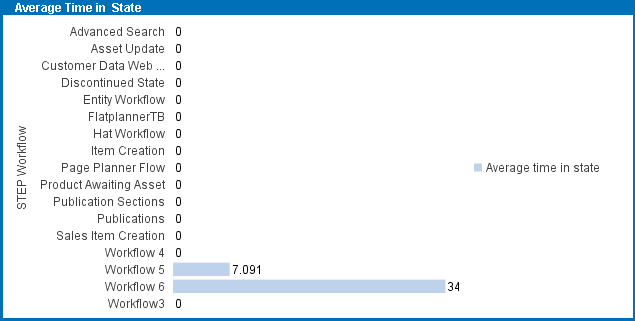
Configuration options include:
- Chart Title - Changes the name that appears on the widget's title bar.
- Available Profiles - Pulls data from the specified Workflow Profile.
- Legend - Determines which aspect of the Workflow Profile to model the data around (such as the workflows themselves or the states of the workflows).
- Value - Determines what values of the Workflow Profile to measure (such as 'Max Time in State', 'Items in State', etc.).
- Orientation - Determines if the bar graph displays vertically or horizontally.
Historical line-chart for STEP Workflow Profile
This widget displays historical data for any available Workflow Profile in a line graph. To ensure this widget is displaying up-to-date data navigate to the applicable STEP Workflow Profile node and click the Update on-demand data button.
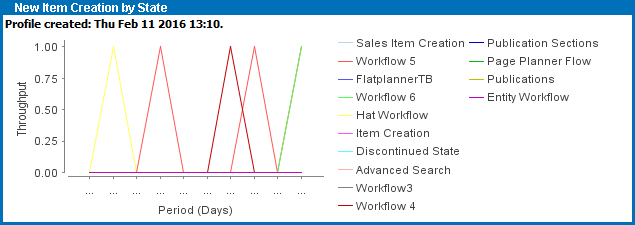
Configuration options include:
- Chart Title - Changes the name that appears on the widget's title bar.
- Available Profiles - Pulls data from the specified Workflow Profile.
- Legend - Determines which aspect of the Workflow Profile to model the data around (such as the workflows themselves or the states of the workflows).
- Historical Column - Determines which column of the Workflow Profile to display data from. The options may very based on how the individual profiles are configured in the system.
Pie-chart for STEP Workflow Profile
This widget displays data for any available Workflow Profile in a pie graph.
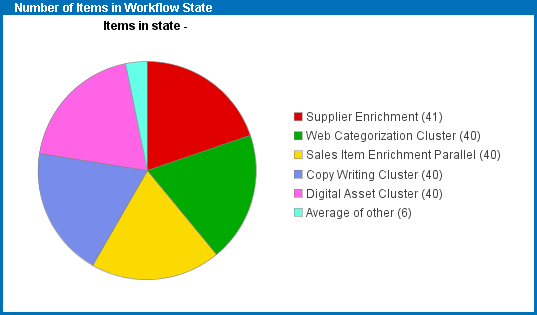
Configuration options include:
- Chart Title - Changes the name that appears on the widget's title bar.
- Available Profiles - Pulls data from the specified Workflow Profile.
- Legend - Determines which aspect of the Workflow Profile to model the data around (such as the workflows themselves or the states of the workflows).
- Value - Determines what values of the Workflow Profile to measure (such as 'Max Time in State', 'Items in State', etc.).
- No. of pie-slices - Determines the maximum number of pie slices that can be displayed in the chart.
- Show average of the other - Displays the average value for those workflows and/or states who's values were too low to be represented by themselves.