2025.1 Features
Below are functionalities highlighted in the 2025.1 update. Click on a link to access content by date / release number.
1. Automatic Asset File Type Conversion
PDX now supports automatic conversion of asset file types. This feature addresses the need for users in PDX to be able to work with various file types, while still meeting the specific file format requirements of downstream syndication partners or retailers.
With this enhancement, PDX will automatically convert uploaded asset files to the required output format during product submission.
Previously, users would receive an error if the uploaded image file type did not match the attribute requirements (e.g., uploading a TIFF when a PNG is needed). Now, the PDX system will convert the image to the correct format upon submission, eliminating these errors.
If a user uploads images with transparent backgrounds (like TIFF or PNG), but the attribute only allows JPEG images, the transparent backgrounds will be converted to white.
This enhancement is supported in Configured Channels where Channel administrators can configure the required file types for their channels. If a specific file type is selected, all uploaded assets for that attribute will be converted to the specified format during submission.
The image below is an example of a channel administrator setting an asset attribute to accept only PNG images. Any assets uploaded or mapped to this attribute will be converted to PNG format upon submission.
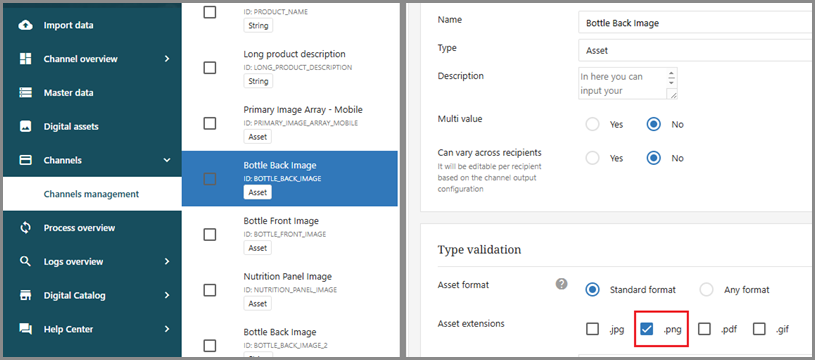
This enhancement is also supported in PDX Direct channels and PDX Onboarding channels that have file type requirements defined, with the exception of the Nielsen Brandbank channels.
If no file type requirements are set, no conversion will occur.
2. PDX System Status
PDX is now integrated into Stibo Systems SaaS Status Page. With this update, PDX users can access important notifications about system performance, unexpected downtime, or scheduled maintenance. To access the status information directly from within PDX, navigate to the Help Center and select 'System Status.'
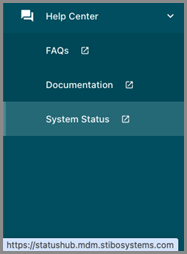
This link will direct you to the SaaS Status Page, where you can view current and historical service statuses.
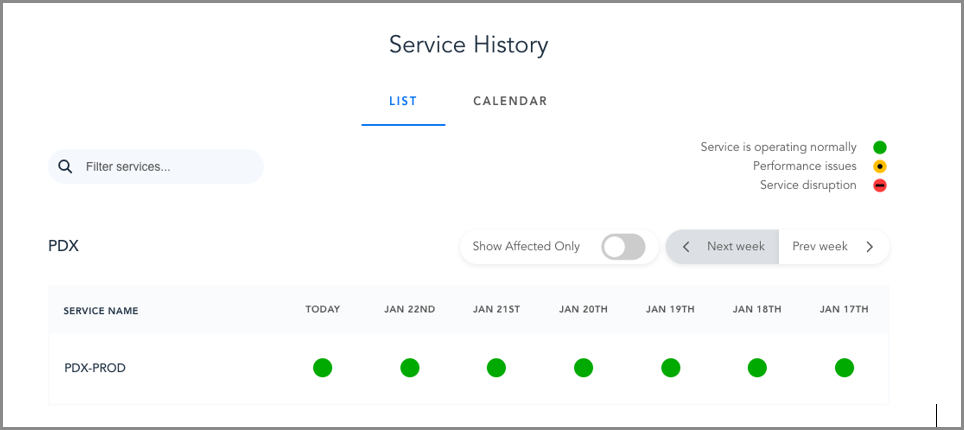
You can also subscribe on the page to stay updated and receive automated email notifications and follow-ups about system events.
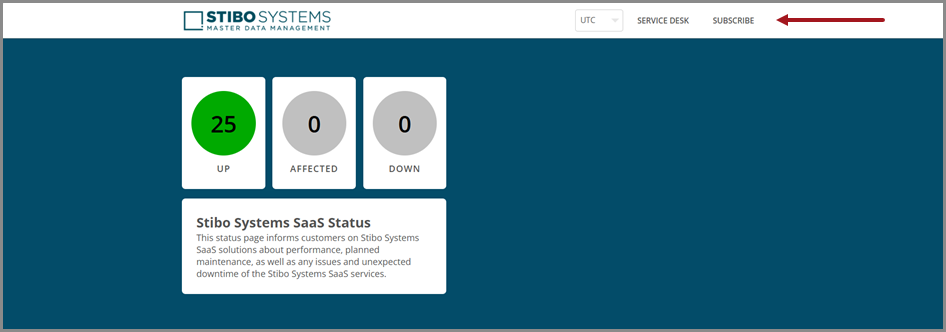
Users do not need to login to check the PDX System Status page. It can also be accessed directly via this link: https://statushub.mdm.stibosystems.com. For further information about system status, visit the Support Services page.
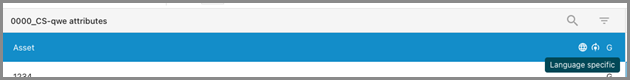
3. Language-specific Icon in Mappings Screen
A visual indicator for attributes that are language specific has been introduced in the mapping screen. The new icon gives an overview of the different types of mappings you are working with.
4. AI-assisted Mappings Available for Amazon and Configured Channels
With this release, our new AI-assisted mapping feature is now available to both Amazon and all configured channels. Admin users can enable AI mapping suggestions via a new toggle in Account > General settings.

Once this feature is enabled, AI suggestions will appear in the channel mappings screen for Amazon and configured channels. The screen will display an AI symbol and a confidence score for each suggestion. The AI will prioritize the highest confidence score items at the top of the screen to help you find relevant mapping suggestions.

Additionally, a new feature allows you to view all mapping suggestions within the mapping screen. The 'Preview AI Suggestions' feature displays a list of all AI-generated suggestions.

This feature allows you to select all or some of the suggestions and apply them all at the same time.

After applying the new suggestion, an icon will be added to the mapping to indicate that it has been mapped using the AI.

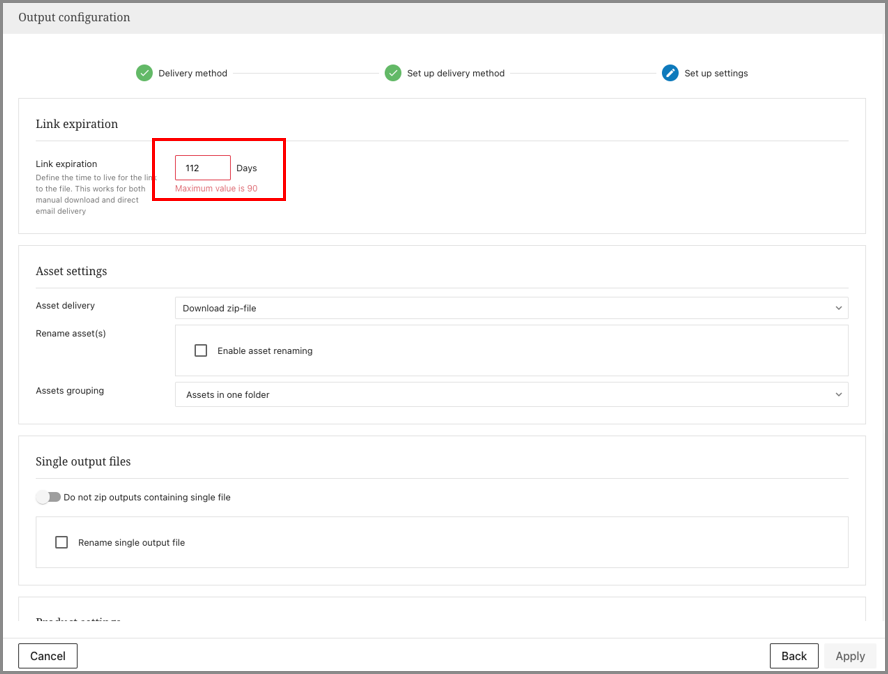
5. Update to URL presigner for Configured Channels
We have updated our URL presigner for configured channels within PDX. Previously, submission link expiry dates could only be extended up to seven days. With this update, they can now be set for up to 90 days.

6. Enhanced Navigation Features
Breadcrumbs have been added to every page in PDX, the admin tool, and Enhanced content. This feature, located below the page title, shows your current location and provides an option to return to the previous screen.
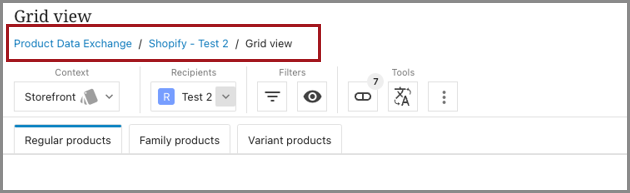
Along with adding breadcrumbs, we have also updated the page titles in PDX to reflect the user's current location. This enhancement provides a better overview and understanding of your position within the application.

Finally, we have enabled keyboard navigation in the menu header of the product view, allowing you to use the Tab, ESC, and Enter keys to navigate.
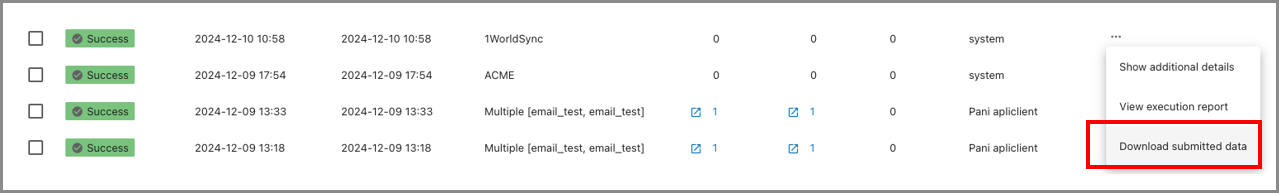
7. Submission Log Capabilities Extended
We have enhanced the submission log with an option to download the HTTP output submit JSON file. By selecting 'Download submitted data' from the action dropdown, you can download the JSON file to your PC. This update improves transparency and helps you understand why a submission marked as successful might have failed.
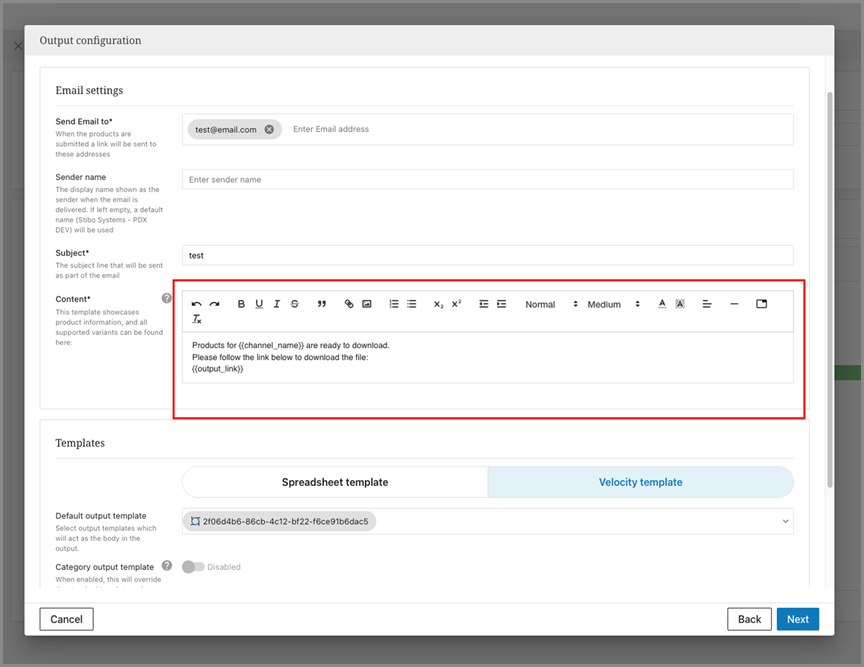
8. Text Editor Changed to Quill
We have switched our rich content editor from CKEditor to Quill. This change primarily affects email layouts used as output receivers within configured channels. Existing email output receivers will not be impacted, but new ones will see some visual changes without major alterations.
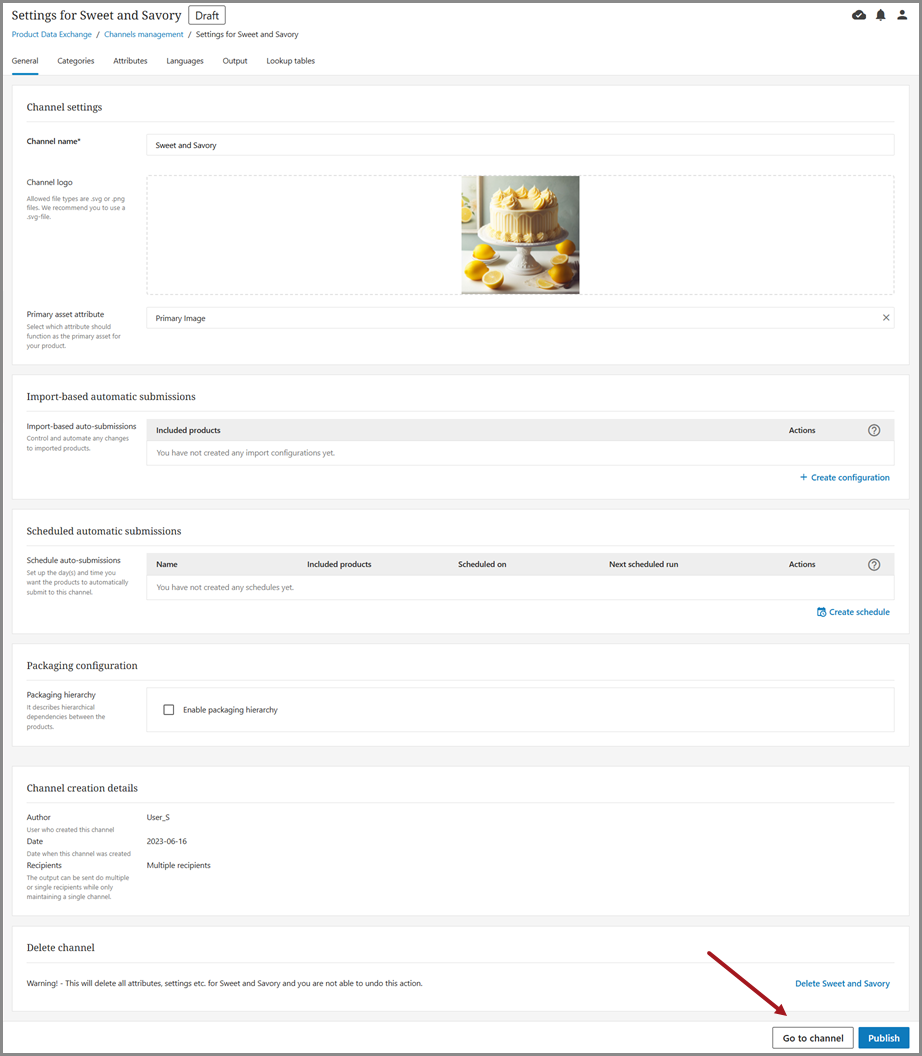
9. New Navigational Button Created
We have implemented a new navigational button in the configured channel management section of PDX. This button functions as a redirect, sending you to the channel you are working on when clicked. This change provides an easy way to make changes to a channel and then move directly into that channel.
10. Internal Retention Period Updated
We have updated PDX to reflect our internal retention period of 90 days. Going forward, you may only select a maximum retention period of 90 days within the PDX application.
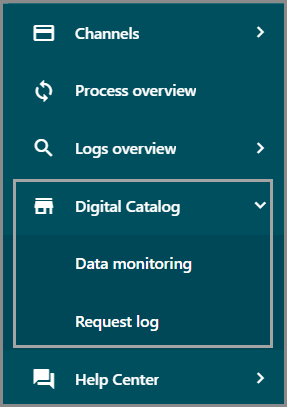
11. Digital Catalog – Data Monitoring and Request Log
The PDX application now includes two new beta pages that display product information for retailers and partners using the Digital Catalog API. These pages are available to customers using the Digital Catalog. Note that filtering and sorting features are not included in this release but will be added later.
Previously, manufacturers had no visibility into the product data pulled from the Digital Catalog. The new pages provide transparency, showing what information partners and retailers have accessed.
Users with the 'Client Admin' role or the 'Digital Catalog API Monitoring' permission can view these pages.
Data Monitoring
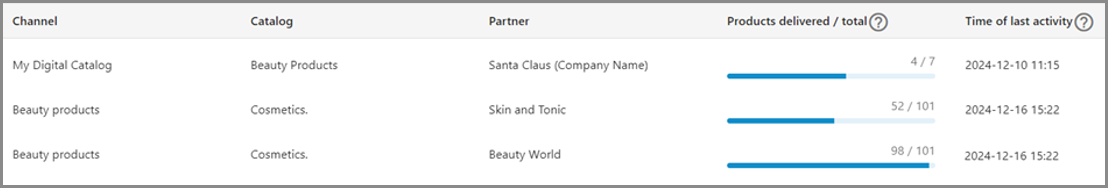
The Data Monitoring page provides an overview of the number of products your partners and retailers have pulled from the catalogs they can access.
Important: Important: The first time the page is opened, the 'Products delivered / total' column may show 0/0 products, even if you have submitted products to your catalogs. To see accurate numbers, products must be resubmitted, as the counter only tracks data submitted after these new pages were introduced.
The page includes the following columns:
-
Channel name: The name of the channel providing product information to your catalog. A channel can contain multiple catalogs.
-
Catalog name: The catalog containing the product information.
-
Partner name: The organization invited to pull information from the catalog.
-
Products delivered / total: The first number indicates how many products the partner has pulled from the catalog using the Digital API. This number updates if the digital catalog user exports products. The second number shows the total products in the catalog. These numbers update each time a partner pulls new information or when a manufacturer updates the catalog with new or updated products.
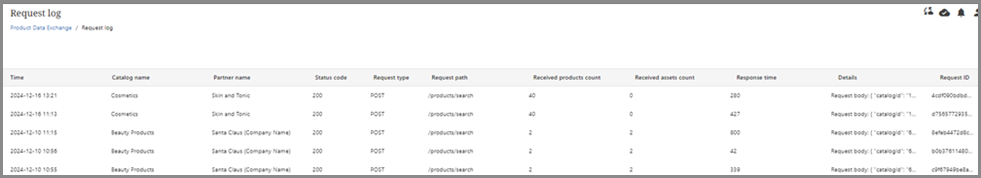
Request Log
The Request log is a page that lists all the requests that has been made by partners. The following information is available for each request:
-
Time: Data and time of request
-
Catalog name: the name of the catalog partners made a request towards
-
Partner Name
-
Status Code: the status code provided in the response
-
Request type: that type of request – POST or GET
-
Request path
-
Received products count: the number of products that the request resulted in
-
Received assets count: number of assets that was a part of the response
-
Response time in milliseconds
-
Details: displays the entire body of the request
-
Request ID