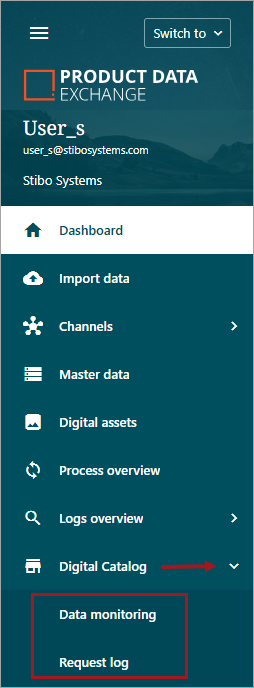
The Digital Catalog menu item expands to open Data Monitoring and Request Log clickable menu items.
Data monitoring
The Data monitoring page provides an overview of the number of products your partners and retailers have pulled from the catalogs they can access.
Important: The first time the page is opened, the 'Products delivered / total' column may show 0/0 products, even if you have submitted products to your catalogs. To see accurate numbers, products must be resubmitted, as the counter only tracks data submitted after these new pages were introduced.
The page includes the following columns:
-
Channel name: The name of the channel providing product information to your catalog. A channel can contain multiple catalogs.
-
Catalog name: The catalog containing the product information.
-
Partner name: The organization invited to pull information from the catalog.
-
Products delivered / total: The first number indicates how many products the partner has pulled from the catalog using the Digital API. This number updates if the digital catalog user exports products. The second number shows the total products in the catalog. These numbers update each time a partner pulls new information or when a manufacturer updates the catalog with new or updated products.
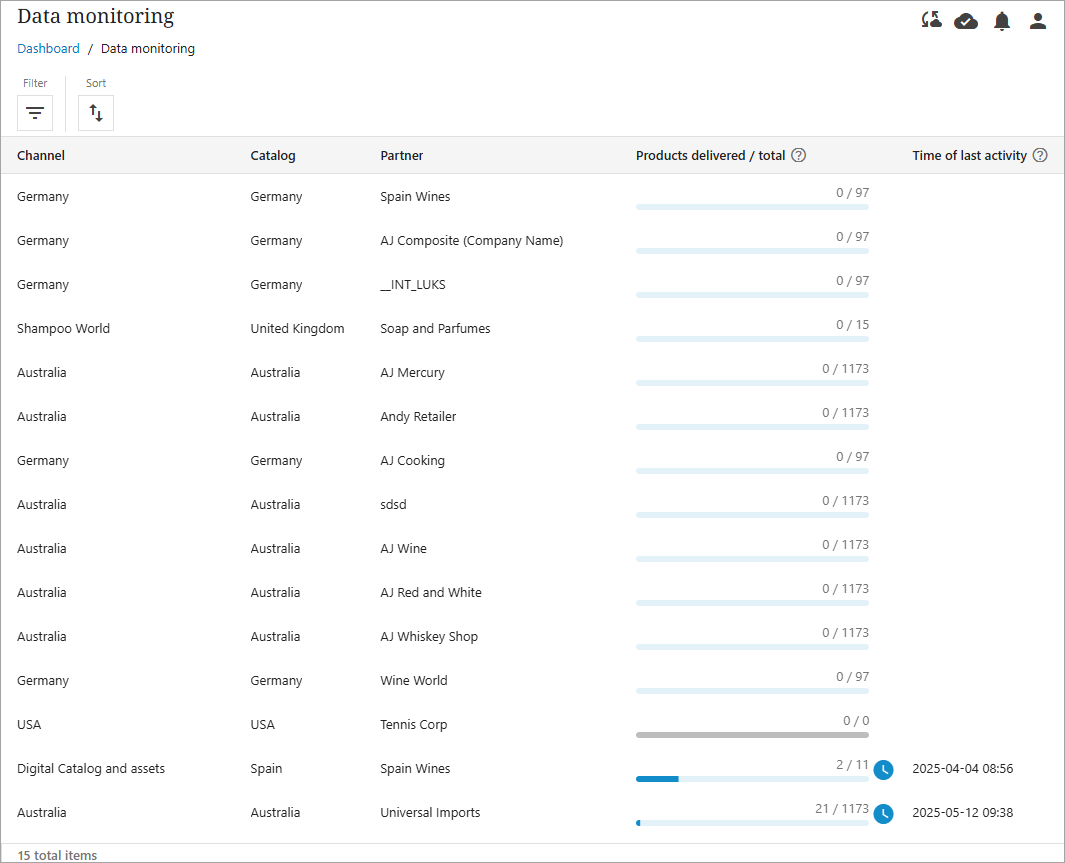
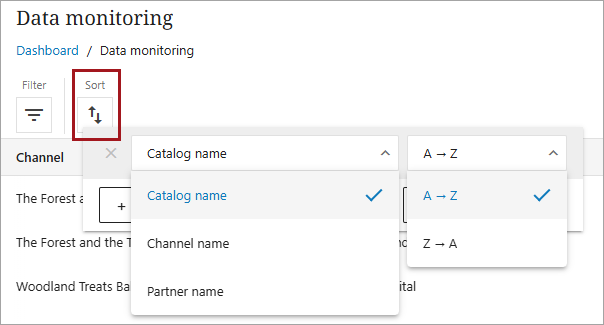
Users can also take advantage of the filter and sort options (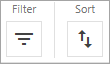 ).
).
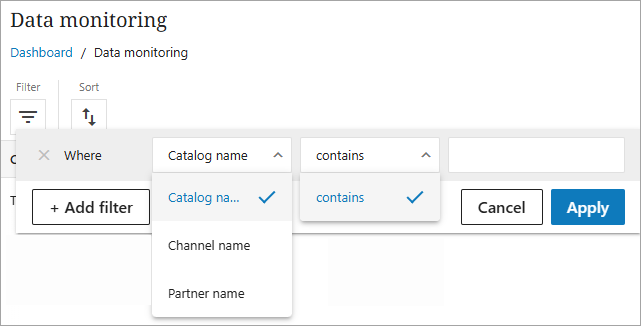
The Filter option allows a user to filter by Catalog name, Channel name, and/or Partner name.
The Sort option allows users to sort by Catalog name, Channel name, and/or Partner name in ascending or descending alphabetical order.
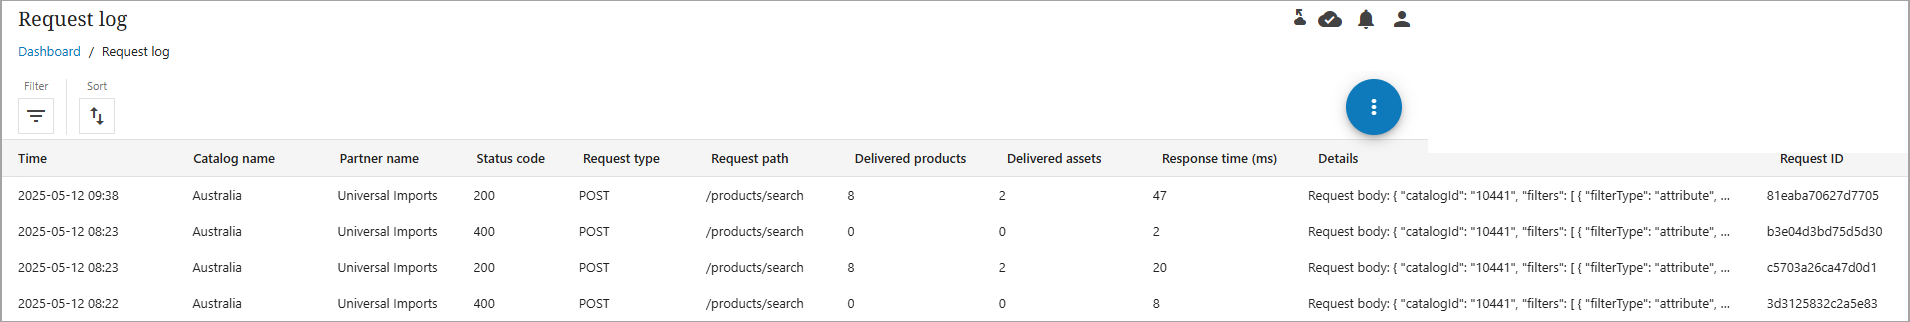
Request log
The Request log is a page that lists all the requests that has been made by partners. The following information is available for each request:
-
Time: Data and time of request
-
Catalog name: the name of the catalog partners made a request towards
-
Partner Name
-
Status Code: the status code provided in the response
-
Request type: that type of request – POST or GET
-
Request path
-
Delivered products: the number of products that the request resulted in
-
Delivered assets: number of assets that was a part of the response
-
Response time in milliseconds
-
Details: displays the entire body of the request
-
Request ID
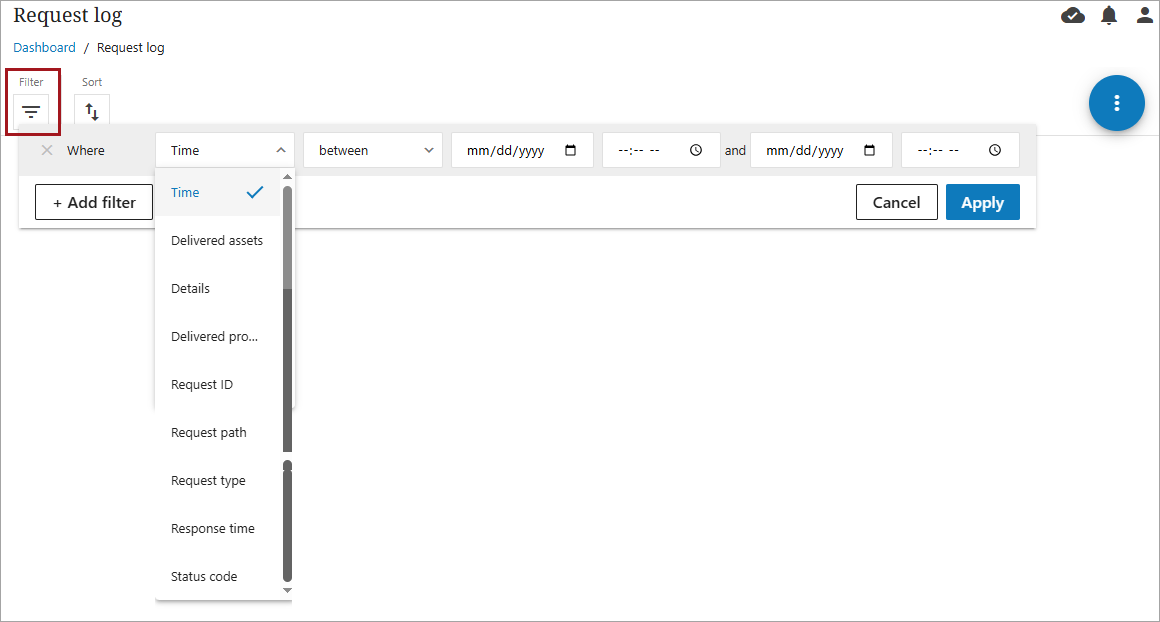
As with Data Monitoring, users can utilize the Filter and Sort options ().
The Filter option allows a user to select a filter from the first dropdown menu in the screenshot below. The additional dropdown menu values will vary based on the first menu selection.
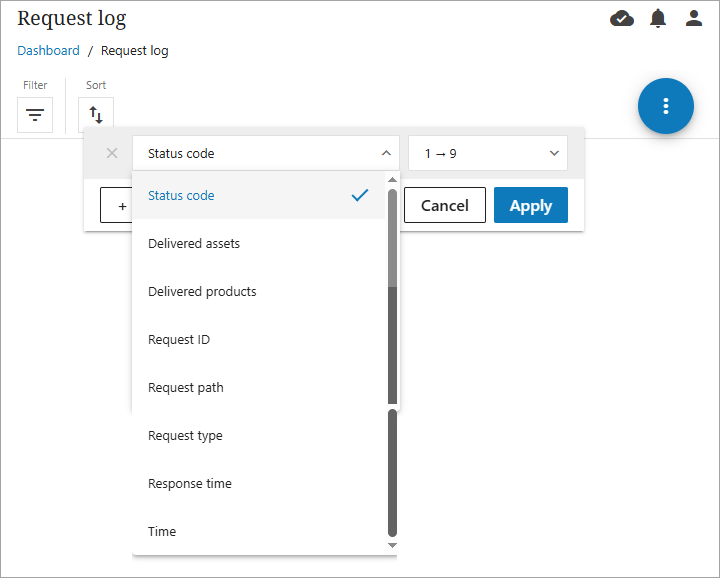
The Sort option allows a user to select a filter from the first dropdown menu in the screenshot below. The next dropdown menu values will vary based on the first menu selection.
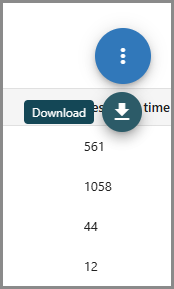
Users can also export logs into a CSV file from the Request log. Filters can be created to show only specified logs. Users can select 'Download' by clicking on the blue icon, and a download process will start. When the download is completed, a link will be displayed in the notification bell.
Note: The Digital Catalog sidebar menu item will not be available to all users. For questions, contact your PDX administrator.