Pivot tables (sometimes referred to as Compact or Compacted Tables), are useful in print applications to display product data in a compact manner. They allow more products and product data to be presented in a smaller physical area than a non-compacted table. Not only does this type of table require less space on a printed page, it also enables the reader to compare similar products. Although it is not always the case, pivot tables usually show more than one product in a single row. In addition to the table's compactness, another purpose of this type of presentation is to allow the reader to view both the common attribute values of similar products as well as their differences.
Pivot tables in STEP are created using the Pivot Transformation. You can apply pivot transformations to any table. However, this transformation does require a high degree of data accuracy and consistency. The following approach is recommended when working with this transformation.
- Create a pivot table type in System Setup if it does not already exist. For more information, refer to Creating Table Types in System Setup here.
- Create a table on a product in the Tree based on the pivot table type.
- Apply a Pivot Transformation to the table, experimenting with different setups.
This initial approach to learning about pivot transformations should help in understanding the functionality of the transformation. It is very likely that you will need to create new row types and/or column types during your initial experiments, so creating these new row / column types on this new table type will be easier to implement, as opposed to modifying an existing table type. After learning the features and capabilities of the transformation, then you may decide to modify your existing table types accordingly.
Areas of a Pivot Table – Introducing the Table Guide
The following figure shows a pivot table that has been specifically created to show how a pivoted table is built. The different areas of the pivot table are identified by the use of background colors. There are seven areas. This table is the same as that which is displayed in the Pivot Transformation Wizard, and is called the Table Guide. As you progress through each step of the Pivot Transformation Wizard, the Table Guide will help you visually by highlighting the area that will be affected by the options you select.
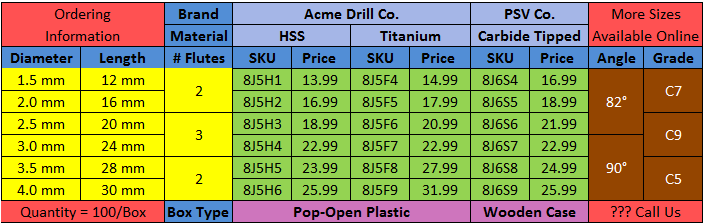
One of the purposes for presenting information in this manner is to allow the reader to easily compare similar products, viewing both their common specification values and their differences. For example, a reader looking at the first part number in the table (8J5H1), can view that there are some similar products, (8J5F4 and 8J6S4). They have the same specifications for Diameter, Length, # Flutes, Angle, and Grade, but have different specifications for the Material and the Brand Name. Since there are differences between these three products, the Price will usually reflect that by also having a different value.
The different background colors identify seven areas. Each of these areas has a separate setup screen in the Pivot Transformation Wizard. The name and purpose of each of these different areas are defined as follows, in the order that they are presented in the Wizard:

The yellow cells denote the Left Common Values area. You may define the attributes that are common to all the products in the same row. The attributes will be located on the left side of the table. There is a similar capability to define attributes that should be placed on the right side of the table (in the brown area). If within the Pivot Transformation no attributes are defined in either of these areas (yellow or brown), then table compaction cannot be accomplished. That is, there must be at least one attribute declared as being a 'common value' attribute for the transformation to function. In the Table Guide, the attributes used in this area are: Diameter, Length, and Number of Flutes (# Flutes).

The light blue cells denote the Top Pivotal Values area. In the Wizard you can identify the attributes to be 'promoted' into one or more header rows and these header rows will be created and placed at the top of the table. There is a similar ability to define one or more attributes to be located in an automatically generated row (or rows) at the bottom of the table, (the dark pink area). For any Pivot Transformation to work, there must be at least one attribute declared as either a Top or Bottom Pivotal Value. In the Table Guide, the 'promoted' attributes in this top area are: Brand and Material.
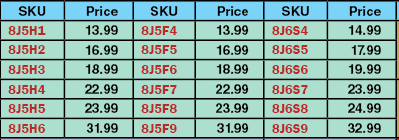
The green cells denote the Compacted Values area. In the transformation you can state which attributes should be placed in this area and these attributes will be rearranged so that products with the same common values will be placed on the same row, and that they will be placed in the appropriate column corresponding to the promoted attributes in the header rows. In the Table Guide the attributes that will be used are the SKU and the Price.

The dark blue cells denote the Column Heading area. In the Table Definition tab a standard setup will have one header row that holds all the column headings for the attributes that are called out in each column. In the Pivot Transformation you can declare certain attributes to use for the table compaction (the 'promoted' attributes), and the system will generate the appropriate number of header rows at the top and/or bottom of the table. In our example, the attributes Brand and Material were the promoted attributes (and Box Type was promoted to the Bottom Pivotal Values area, not shown). Since the cells with the attribute names in the generated top and bottom header rows originated from the first row in the table definition (the column headings row), they are still considered as 'column headings', thus the reason for showing them in their dark blue color. It is easy to suppress these attribute names from appearing.
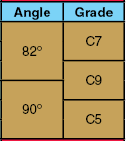
The brown cells denote the Right Common Values area. This is an identical setup to that of the Left Common Values area. In any Pivot Transformation there must be a minimum of one attribute defined in either the Left Common Values or the Right Column Values. If no attributes are defined in either of these areas, (yellow or brown), table compaction cannot be accomplished. In the Table Guide, the attributes used in this area are: Angle and Grade.

The dark pink cells denote the Bottom Pivotal Values area. This is similar to the Top Pivotal values area, with the exception that the system will generate an appropriate number of header rows at the bottom of the table depending on the attributes selected. For any Pivot Transformation to work, there must be at least one attribute declared as either a Top or Bottom Pivotal Value. In the Table Guide, the attribute in this bottom area is: Box Type.
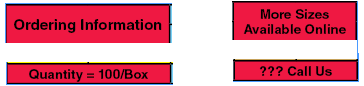
The red cells denote the table's Corners area. These areas are really independent of one another and may be used for a variety of purposes. You may enter free text into any of these areas, or you may access attribute values or image references from the original defined table. In the Table Guide, the information in the top left, top right, and bottom right corners are all free text. In the bottom left corner an attribute has been called out to display the 'Quantity per Package type' attribute.
Preparing Tables for Pivot Transformation
The contents of table cells may be free text, product attribute values, product Names or IDs, meta-data, product references, or asset references. In order to simplify this documentation only product attributes and free text are used for the cell contents. But the other cell content types are equally valid and may be used in the Pivot Transformation.
It is recommended that the tables that are going to be involved with pivot transformations are all constructed in a similar manner. That is, products in rows and attributes in columns are shown in the following general example that matches that shown in the Table Guide.
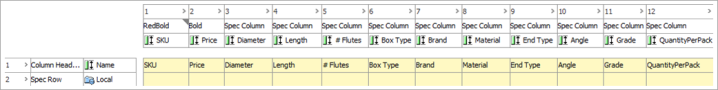
In the example shown, there is only one header row used for the Attribute Names. It is of no use to set up a Table Definition with more than one header row, since it will conflict with the Pivot Transformation. The transformation will create additional header rows according to the setup within the transformation. It will only accept one header row in the original Table Definition.
In the above example, the elements are organized in the following way. The first two columns will be used in the Compacted Values area, the next three columns will be used for the Left Common Values, columns 6, 7, and 8 will be used to generate header rows at the top and bottom of the table, and columns 10 and 11 will be used for the Right Common Values. Column 9 is included in the table definition (attribute = End Type), but if an attribute is not 'mentioned' in the Pivot Transformation then it will be ignored (filtered out) and will not appear anywhere in the resultant transformed table. Thus column 9 is included only to demonstrate that it is not present in the transformed table, regardless of whether or not there are attribute values in that column. As far as the Table Guide is concerned, column 9 is redundant. And as far as the Pivot Transformation is concerned, it does not exist. The attribute in column 12 will be used in the bottom left corner of the pivoted table.
Notes
The product attributes are all called out individually in this table definition, and the content definition of 'Attribute Groups Attributes' has not been used. That option may be used if it is desired that the table is more 'dynamic', and to reduce the number of localized tables. However, the Pivot Transformation does require that you state exactly which attributes are to be used in the different areas of the table, either by attribute, Column Number, or Column Type. So if you do use the 'Attribute Group Attributes' method you must know beforehand which attributes in that group to include within the transformation. Empty attribute columns can be easily discarded either within the Pivot Transformation or via the standard transformation that removes empty columns and rows.
The above setup does make use of the content definition 'SubProducts, Family', so that the number of rows that initially make up the table is dynamically sized according to the number of child products in the product family. If a successful table compaction is done, there will be fewer rows after the pivot transformation.
You can create different column types for the different 'areas' in which the attributes will be used. But you should be aware that no matter what you set up in the table definition tab you will still need to declare the different row and column types within the transformation, since during the transformation all the original row and column types are basically 'discarded'. So for the Table Definition, whether or not you organize your tables with different column types is a matter of personal choice. However, there is one major advantage to assigning the column types to match their intended 'area' in the pivoted table, and that will also be explained later in the Working with the Pivot Transformation Wizard.