Summary
Performance Analysis tools enable administrators to analyze system health and data to proactively identify issues that could lead to sub-optimal performance, as well as to troubleshoot cases where a performance impact has been observed. To support this, a new interface has been provided that displays the creation and consumption of events, system activity, and the results of weekly scheduled health checks (including several new health checks designed specifically to expose configurations that may lead to poor performance). The new tools are intended to be used in conjunction with one-another and support customers in independently optimizing their system configurations for better overall health and performance, leading to higher efficiency, reduced dependency on Stibo Systems Support team, and less overall disruption of the business.
Details
The new Performance Analysis consists of a separate user interface that contains three analysis tools: Health Checks, Activity Tree, and Events. Using the Health Checks screen, in conjunction with the Activity Tree and Events graph, can help to identify slow-running processes and correlate issues with event queue activity to identify whether business rule logic, data objects, and/or event handling are contributing to poor system performance.
Performance Analysis
The Performance Analysis tools can be accessed via the Performance Analysis link found on the Resources section of the Start Page.
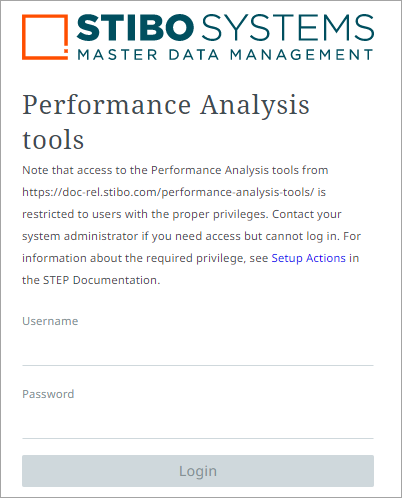
Once logged in, the user can navigate to the Health Checks, Activity Tree, or Events screen.
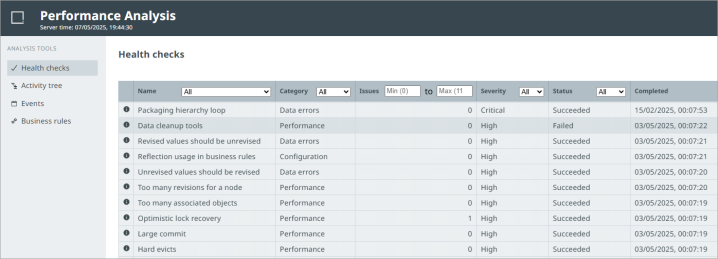
Health checks
The Health Checks screen displays a table listing the health checks completed for the scheduled runtime, sorted by the most current execution and providing 12 weeks of history to help identify patterns over time. Taking action on the identified data and configuration issues will help prevent issues from growing to a level where the issues are more difficult to resolve.
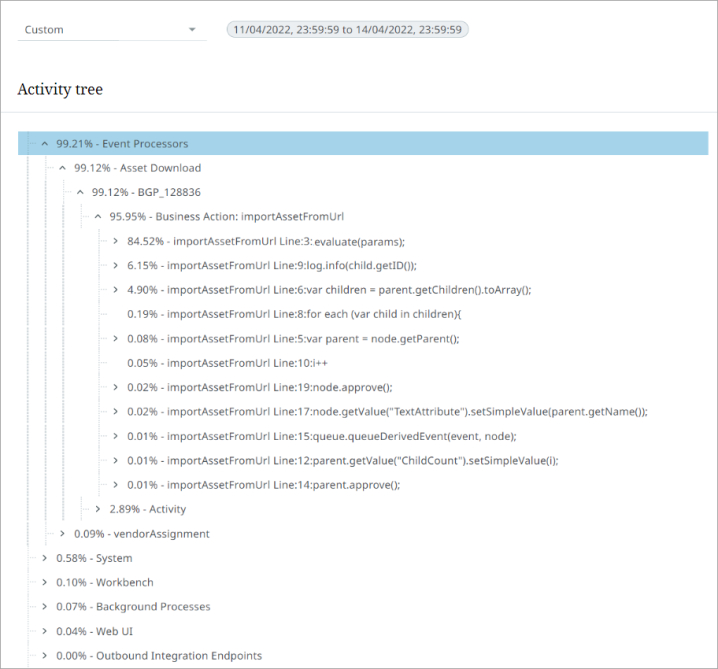
Activity tree
In the Activity Tree screen, a user can investigate short-term performance issues when there is a known problem (e.g., event consumption lagging creation, overall system slowness, BGP not progressing, etc.) but the cause is unclear. This drill-down tree helps the user discover the problematic activity and/or process, in addition to determining the possible cause.
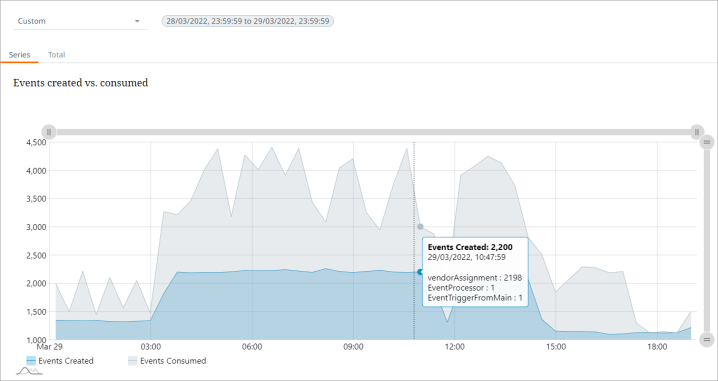
Events
On the Events screen, the 'Events Created vs. Consumed' graph allows the user to visualize event processing in two ways. The Series tab allows the user to view a line graph of all the events created versus those consumed within the defined time period. The Total tab displays the events created versus those consumed with individual queue counts in a bar chart. Mouse-over text shows the three event queues with the highest count of events for the selected date / time.
Using Performance Analysis tools
For example, a system is configured to trigger an Event Processor executing a business action following the import of products, which triggers an Outbound Integration Endpoint, sending the changes to a downstream system. This flow can quickly create a high volume of events in the system, assuming the import volume is high. The Events graph shows the rate of event creation on one line and the rate of event consumption on another line of the same graph, which shows how well the system is able to process changes. A minor phase-shift is typical between creation and consumption of events, based on schedules and execution time of the business action. In this example we’ll assume there is an action taking more than a few seconds to execute. This could be because the action is written inefficiently or it encounters objects that have a lot of children or references or values or revisions or there are time delays while concurrent updates to the same object in a different transaction are retried, or other issue. In any of these cases, the consumption of events will lag behind the creation significantly. When this occurs, the weekly executed health checks will also indicate issues, detailing which objects, the number of occurrences, timestamps, and the related BGP ID. Using the information from the health checks and lag in event processing, the Activity Tree screen will be useful to drill into an identified timeframe to help indicate the configuration areas where the system is spending the most time. Exploring the Activity Tree for the highest percentages below the Event Processors exposes the ID of the problematic Event Processor, the BGP ID, the ID of the Business Action and the lines of code where the system is spending the most amount of time. By combining the information in these screens, the administrator is empowered to quickly identify the contributors to performance issues, continue to research, modify and test to resolve the identified issues, which may involve rewriting a business action, adding an Event Processor to manage revisions, restructuring hierarchies, or other configurations changes, in order to optimize the system performance.
STEP Workbench
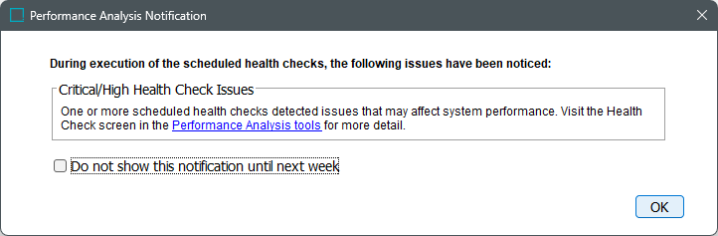
If any of the scheduled health checks detect an issue that has either a critical or high severity, the schedule has been disabled, or there is not enough time to complete all scheduled health checks within the execution window, users who have the View Administration privilege will view a popup upon opening the workbench. This alert allows the user to review the issue(s) in the Performance Analysis tools.
The background process execution report for the scheduled health checks can be viewed in the workbench. Additionally, there are two new configuration properties:
-
HealthCheckScheduler.AutoRun: Allows the user to disable, enable, or skip the automated execution for a date in the future.
-
HealthCheckScheduler.OperatingDayAndHours: Allows the user to schedule the start day(s) of the week and window of execution for the health checks.
For more information, refer to the Performance Analysis documentation here.