Errors may occur when business actions are used to access gateway endpoints. Typical errors include not being able to access the external system or the external system not containing the data being requested in the business action. Errors can be monitored from within STEP or by directly accessing the endpoint via a URL.
Monitor from STEP
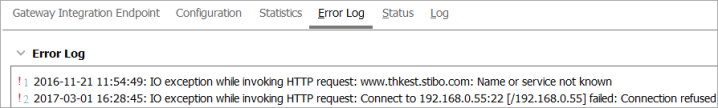
Any unexpected response status is received and logged in the Error Log tab on the gateway integration endpoint. This provides an overview of all logged errors on the gateway integration endpoint.
In the following example, an unexpected response status is logged when a method has been executed to retrieve data on an object which did not exist on the external system.
Monitor Outside of STEP
The following URLs allow you to get an overview of the status and any errors on processes without logging onto STEP.
View all endpoints
Use the following URL, replacing <environment_name> with your own environment name.
http://<environment_name>/admin/monitoring
For example:
http://myenvironment/admin/monitoring
Endpoints are listed by name in the Sensor column of the list displayed.
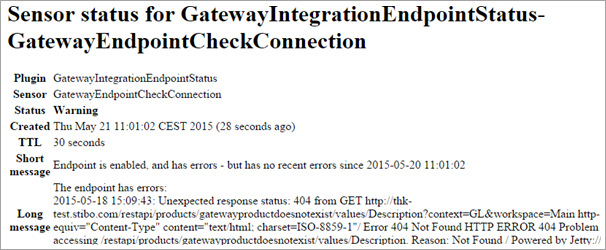
View a specific gateway endpoint
Use the following URL, replacing <environment_name> with your own environment name, and replacing <Gateway-ID> with the STEP ID of the desired endpoint. The ID is displayed in the gateway integration endpoint editor. For more information, refer to Maintaining a Gateway Integration Endpoint topic.
http://<environment_name>/admin/monitoring/GatewayIntegrationEndpointStatus-<Gateway-ID>
For example:
http://myenvironment/admin/monitoring/GatewayIntegrationEndpointStatus-GatewayEndpointCheckConnection
A report similar to the one below is displayed for the identified gateway endpoint with the ID 'GatewayEndpointCheckConnection.'