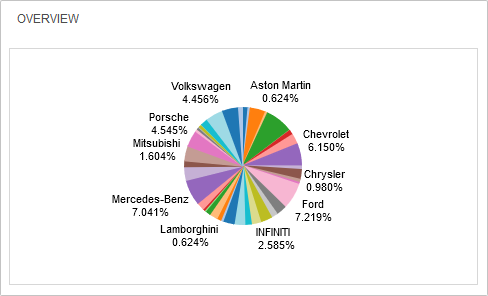
The Web UI supports visual integration with data analytics tools like Tableau Server, Qlik, and Power BI. Through configuration of the Web UI, admin users can add both homepage widgets (example shown below) and Web UI screens designed specifically to display visually compelling views of data (dashboards, reports, and/or tiles) from data analytics tools.
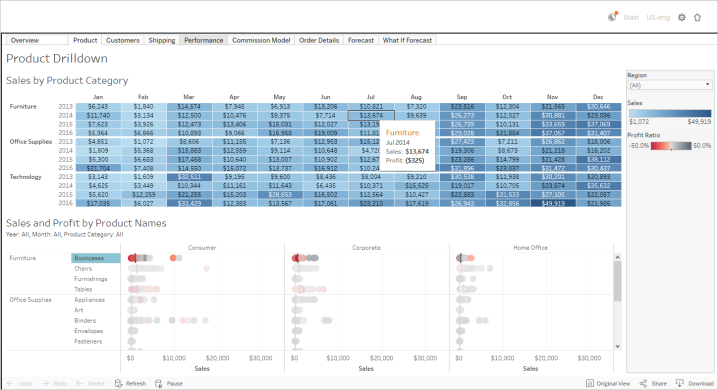
When working with Tableau or Qlik, the Analytics Widget Web UI component (shown above) is useful as a quick, simplified view of a dashboard, while the Analytics Screen Web UI component (shown below) offers a more expansive view of analytics data, allowing for more interaction.
Users have the ability to utilize analytics tools in a variety of ways. They may:
- Interact with dashboards composed of both master data and external data within the Web UI
- Apply filters to analytics widgets and screens that give users tailored views of data analytics dashboards, reports, and/or tiles
- Configure the Web UI to pass attribute value data into the analytics platform, thus making product-specific views of data from the analytics platform
Information related to configuration of data analytics tools for Tableau and Qlik in the Web UI can be found in the Visual Integration with Tableau or Qlik topic.
To accommodate authentication with the Microsoft API, the Power BI integration uses its own components, the 'Power BI Analytics Widget' and the 'Power BI Analytics Screen.' These are detailed in more depth in the Visual Integration with Power BI topic.
Prerequisites
To access the Web UI analytics components, the X.WebUI.Analytics license must be enabled on your system. Contact Stibo Systems for more information and to enable licenses for your system.