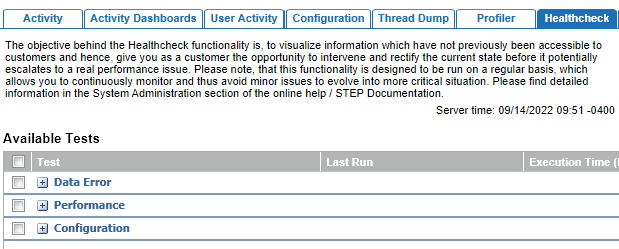
The Healthcheck tab is intended to assist users on an ad hoc basis to identify and resolve system and performance issues. A set of standard tests are available, and Stibo Systems may add additional tests as needed. The upper portion of the screen allows users to select healthchecks to be run, while the lower portion provides results for the checks.
Note: Scheduled healthchecks and the statistics for previous automated healthchecks can be accessed via the Performance Analysis tools. For more information, refer to the Performance Analysis documentation.
Users can select the tests to be run and view a list of issues if any are found. In some cases, fixes are made available. As fixes should only be applied only under the direction of Stibo Systems, applying a fix requires a password that must be obtained from Stibo Systems Support. However, some issues identified may be solvable by administrators and the tool serves merely to bring them to light. In addition, it provides a way to aid Stibo Systems in resolving reported issues. If a system is having performance issues, administrators should run the available healthchecks and send them to Stibo Systems using the Send Diagnostics tool described in the Send Diagnostics topic.
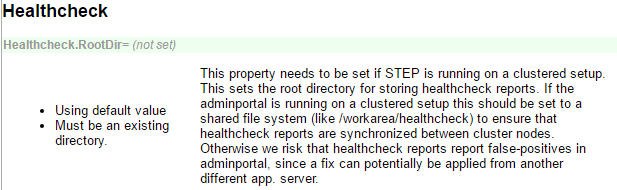
Note: Use of this functionality on a clustered environment requires that the Healthcheck.RootDir configuration property be set to a shared path to ensure that the healthcheck reports are available, regardless of the application server node that the admin portal is accessed from.
Running Healthchecks
A list of available checks to run on an as needed basis is populated in the upper half of the tab. Additional checks can be provided by Stibo Systems Support as needed, and new default checks may be added regularly. Clicking the yellow information icon available in the Test column provides a detailed description of each test, as well as considerations for running it.
For a list of all healthchecks, including both manually run and scheduled healthchecks, refer to the Healthcheck Test Index topic.
Important: Some checks may be time consuming to run and/or may impose a load on system resources when running. It is important to read the considerations provided in the yellow information icon prior to running any tests so that they can planned for accordingly.
To run healthchecks:
-
Use the row checkboxes to select one or more tests to be run. This enables the Run Selected Tests button.
Important: Do not run all checks at once. Review the details of the checks before running to limit degraded performance.
-
Click the Run Selected Tests button to begin execution of the selected test(s).
-
Watch for the Last Run field to update, indicating completion of the test.
-
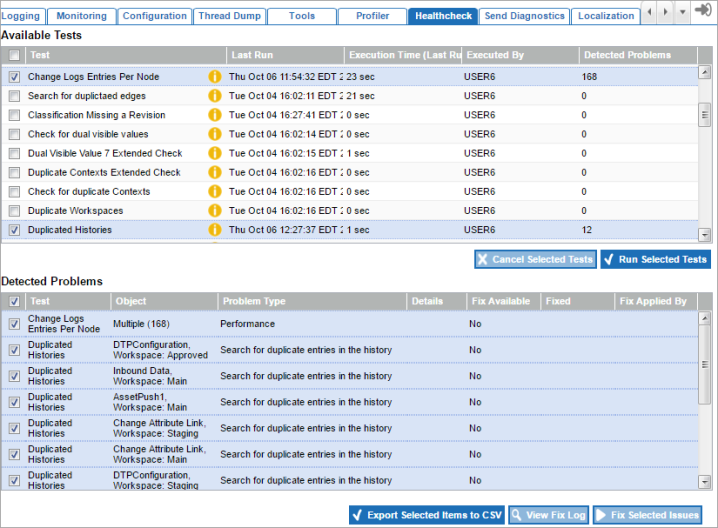
View the Detected Problems column. A zero (0) value indicates no problems have been found. A non-zero value indicates the number of issues identified from the check.
-
Check the row box for any tests with problems to view results. Only the tests that are checked in the upper half of the screen will display results in the lower half so this can be used to filter large result sets.
Refer to the 'Healthcheck Results' section below for more information on the results of the tests and available actions.
Healthcheck Results
When a test has completed with one or more problems detected, the lower half of the screen displays one row for each detected problem (or set of problems) for the tests that are selected. In addition, healthcheck information is also stored on the application server at [STEPHOME]/diag/healthcheck (e.g., opt/stibo/step/diag/healthcheck), and is automatically included when a diagnostics package is sent to Stibo Systems Support. More information on sending diagnostics can be found in the Send Diagnostics topic.
Note: The upper and lower portions of the screen interact. To refer to results for any test in the lower half, the corresponding checkbox in the upper portion of the screen must be checked for that test. Therefore, this is also a means of filtering the result set if multiple tests have been run. To display results for only a single test, uncheck the other tests in the upper half of the screen.
Many detected problems are manually solvable by system administrators. Others may be common issues for which Stibo Systems has developed an automatic fix that can be applied. In these cases, the 'Fix Available' column displays 'Yes' and a yellow information icon displays that provides additional information about the available fix. Automatic fixes should be applied with care and only under the direction of Stibo Systems. Therefore, a password is required to access automatic fixes. Additionally, some problems may require the assistance of Stibo Systems to resolve manually. In any case where administrators cannot resolve the identified issues, contact Stibo Systems Support for assistance. Note that for any cases where assistance is required, it is important that a diagnostics package be sent to Stibo Systems with the request so that all information to aid in resolution of the issue is made readily available.
Actions can be taken on the detected problems, which are applied only to the row(s) selected via the row checkboxes. The available actions are:
-
Export Selected Items to CSV: Exports the selected results to a CSV file. Many detected problems can be manually corrected by administrators, which can be facilitated by providing an export of the result set to work from.
-
View Fix Log: If an automatic fix for a particular problem has been applied, this displays a pop-up with information about the fix. This button is only enabled when a single result is selected for which a fix has already been applied.
-
Fix Selected Issues: This button is only enabled when all selected rows have fixes available. Note that information about the fix is available by clicking the yellow information icon (available in the 'Fix Available 'column whenever it is populated with 'Yes'). Clicking the 'Fix Selected Issues' button opens a dialog with a password field as automatic fixes should be applied only with the guidance of Stibo Systems Support. To request a password, contact Stibo Systems Support. When a password has been obtained and accepted in the dialog, fixes will be attempted for all selected rows.
When taking action on the selected results, it is important to be aware of how the results are displayed. Some tests are able to report a series of nodes individually for results, while others are only able to report a count (without individual nodes). These are referred to as Result Type of 'Node' or 'Group,' respectively. Some problems have fixes available, while others do not. When fixes are available, sometimes they can be applied to nodes individually, while other times they can only be applied to the full problem set at once. Furthermore, for usability, result sets over 50 are grouped in the results interface, but details on individual nodes can be accessed via export if the result type supports it. Therefore, it may be possible in some cases to examine individual results only in an export, or to take action only on a group, even when individual results are available via export. The below table outlines the behavior of the display and the available actions.
| Result Type | Result Size | Fix Available | Display | Export |
|---|---|---|---|---|
|
Node |
< 50 |
No |
Nodes |
Nodes |
|
Node |
> 50 |
No |
Group |
Nodes |
|
Node |
< 50 |
Group |
Group |
Nodes |
|
Node |
> 50 |
Group |
Group |
Nodes |
|
Node |
< 50 |
Individual |
Nodes |
Nodes |
|
Node |
> 50 |
Individual, but fixes in this category will always be implemented as a group as individual nodes are not selectable |
Group |
Nodes |
|
Group |
N/A |
No |
Group |
Group |
|
Group |
N/A |
Group |
Group |
Group |
Each column in the results table is described below:
-
Test: The name of the test that identified the problem. The results table can be filtered using the checkboxes in the upper portion of the screen (only those checked will display results).
-
Object: The ID of the object in the database for which the problem was detected, and other identifying information if applicable (e.g., Workspace).
-
Problem Type: Description of the type of problem discovered.
-
Details: Displays samples and approximate timestamps.
-
Fix Available: Displays 'Yes' or 'No,' indicating whether or not a fix is available. If a fix is available, a yellow information icon is present that can be clicked to display a description of the fix, which can then be executed by checking the applicable result row and clicking the Fix Selected Issues button and providing an appropriate password, as described above.
-
Fixed: Displays date and time the fix was completed, when applicable.
-
Fix Applied By: Displays the user who executed the fix, when applicable.