The Activity tab is the first tab in the admin portal and provides information about the STEP application and application servers without having to log in to any server directly. This allows users to monitor the information about the activities and processes being performed on the STEP application and their impact on the server(s). A variety of information is available that is valuable for general monitoring purposes and/or troubleshooting.
The information is divided into Chart and Details sections, and displays neither by default. This topic addresses how to access data for the tab, as well as providing descriptions for the information that is available via this interface.
Query Parameters and Accessing Data
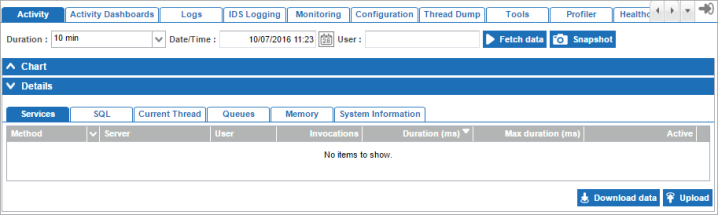
Before gathering data for the tab, it is important to consider what information is required, and to use the provided parameters to specify this. Once the query parameters have been specified, the Fetch data and Snapshot buttons can be used to access the information from the system.

Duration: Required parameter to specify the duration of the of time for which activity should be displayed, ending at the time indicated in the Date/Time parameter. Using the above screenshots as an example, data will be displayed for the 12:33 - 12:43 time period.
Note: If 2 or 4 hours is selected for the display, the Details data described below are unavailable and data will only be displayed in the Charts section.
Date/Time: Required parameter to specify the end of the time period for which activity should be displayed. The parameter can be edited using the date picker icon to the right of the field, or by typing in the field directly using the format MM/DD/YYYY HH:mm.
User:Optional parameter used to restrict the displayed data to only that of a single user. If used, the STEP ID of the desired user should be typed directly into the field. If left blank, data for all users will be displayed.
Fetch Data: Data is regularly sent to the application server(s) for profiling, and can be accessed at [STEPHOME]/diag/profiling (e.g., opt/stibo/step/diag/profiling). Clicking Fetch Data collects all profiling data that has been sent previously that meets the criteria defined by the Duration, Date/Time, and User parameters and displays it to the user within the admin portal for viewing and analysis.
Snapshot: Invokes a manual sending of profile data to the application server(s), specific to the time at which the snapshot is requested (e.g., NOT subject to the Duration, Date/Time, or User parameters). This creates a .ZIP file that on the application server at [STEPHOME]/diag/profiling (e.g., opt/stibo/step/diag/profiling). This can be used when the user needs to collect data to send to Stibo Systems Support to assist in system analysis and troubleshooting. However, it is preferred that the Send Diagnostics feature be used in place of this to ensure that the complete set of relevant information is sent. Refer to the Send Diagnostics topic for more information.
Chart Data
The Chart section of the interface displays a graphical representation of the data, per the query parameters. CPU, Memory, and Thread usage are displayed, along with buttons to hide the displays if needed.
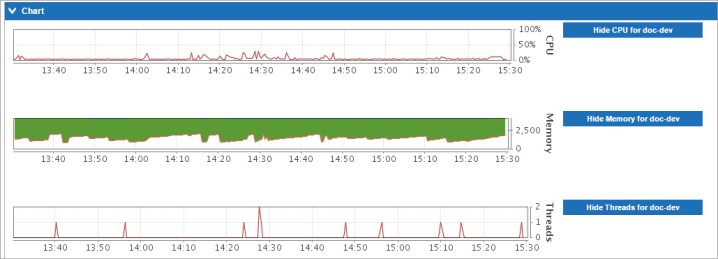
CPU: Displays the CPU load over time put on the application server by running STEP. It is not reflective of any processes running on the server outside of STEP.
Memory: Displays the percentage of the memory usage (heap) spent over time by the STEP application, in relation to the maximum limit set up for the application sever process.
Threads : Displays the load put on the system over time in terms of concurrent ongoing active threads.
Details Data
When the Fetch data action has been used, detailed data is included for system activity, per the provided parameters (Duration, Date/Time, and User). The Details section contains 6 tabs, each of which is described below.
Note: Detailed data is only available when Duration is set to 20 minutes or less.
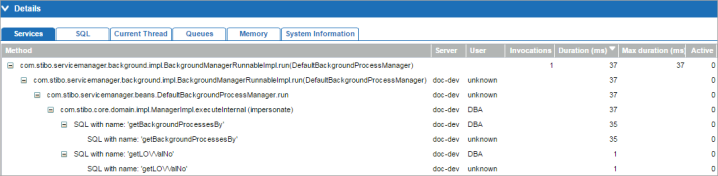
Services
The Services tab details the profiling information gathered from the systems services, allowing users to drill down into different service calls inside the application. By default, method calls are sorted by duration. Therefore, if users are experiencing performance problems, it is possible to identify long running method calls that could be contributing to the issue. Additionally, this information can be used to determine whether it is core STEP functionality or a custom extension that is contributing to the issue. However, some interpretation of the data is required so this information is typically used only by Stibo Systems Technical Support.
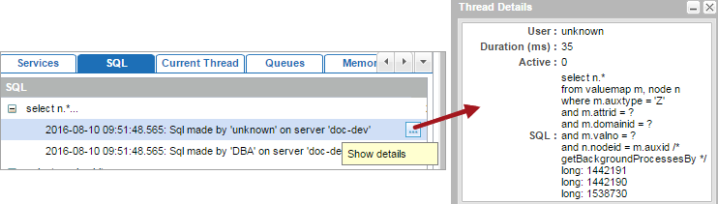
SQL
The SQL tab displays the SQL queries that have been executed by the system services. This is similar to the information shown on the Services tab, but reports on the use of SQL queries rather than standard methods. As with the Services tab, these items are also sorted by duration, which can assist in identifying long running queries that could be causing performance issues. However, the information is typically only used by Stibo Systems Technical Support as some interpretation of the data is required.
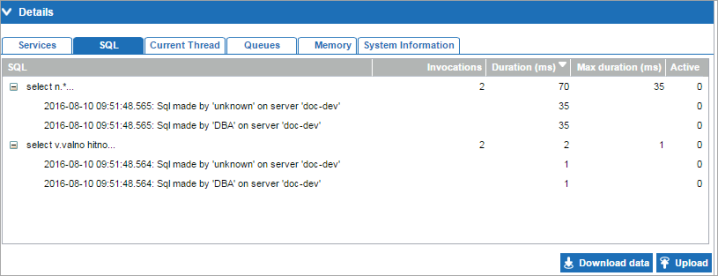
Users may hover on a row to expose the ellipsis button ( ). When clicked, a Thread Details popup is provided that displays the full SQL statement.
Current Thread
The Current Thread information is recommended exclusively for use by Stibo Systems Technical Support and is therefore not described.
Queues
The Queues information is recommended exclusively for use by Stibo Systems Technical Support and is therefore not described.
Memory
The Memory tab displays statistics for memory usage and garbage collection (GC), which can be useful in troubleshooting performance issues.
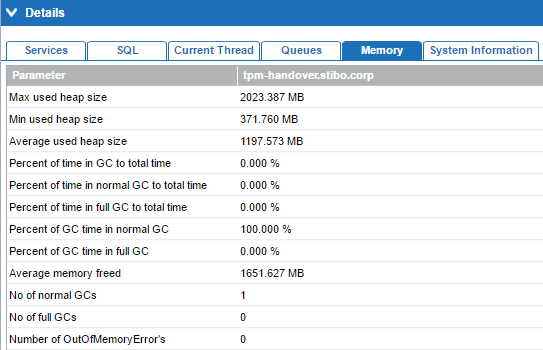
Note: Data is only available on this tab if Java Garbage Collection has been run on the system.
System Information
The System Information tab displays basic information about the system being profiled.
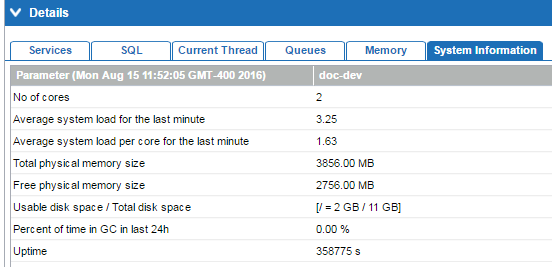
Note: System information is automatically included in diagnostics packages sent to Stibo Systems. For more information on sending diagnostics, refer to the Send Diagnostics topic.
Download / Upload
In the lower right corner of the Details section, Download data and Upload buttons are available for sending and/or viewing activity information. For example, if Stibo Systems does not have direct access to a system but it is necessary to provide activity data to them for support activities, the data can be downloaded using the Download data button. This could then be sent to Stibo Systems, who could upload it to view the data contained in the package. However, as with the Snapshot functionality, it is preferred that the Send Diagnostics feature be used in place of this to ensure that the complete set of relevant information is sent. Refer to the Send Diagnostics topic for more information.
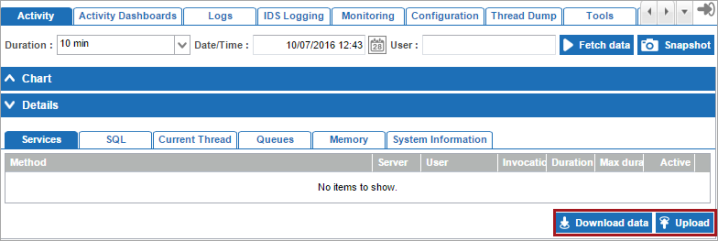
The download function is not specific to the current selection, meaning that all data accessed in the fetch data / snapshot actions is included in the download. The download provides a zipped file containing an XML file with the data, along with an additional zipped file with the system logs from all servers in a clustered environment.